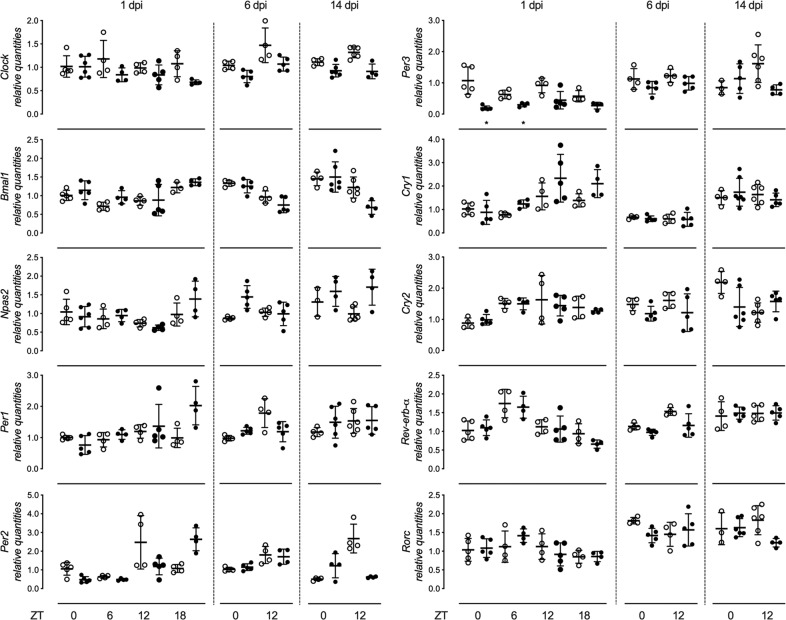
Figure 4.
Relative mean expression (±SD) of clock genes (Clock, Bmal1, Npas2, Per1, Per2, Per3, Cry1, Cry2, Rev-erb-α and Rorc) in ipsilateral dorsal hippocampus at 1, 6 and 14 days post injection (dpi) of KA in adult male mice. ZT0, ZT6, ZT12 and ZT18 (ZT = Zeitgeber time, ZT0 lights on, ZT12 lights off). White and black circles represent individual values for control and KA groups, respectively. The t-test with multiple-testing correction was performed to evaluate significance between control and KA groups. *p < 0.05. Figures were created using GraphPad Prism version 8.3.1 for macOS, www.graphpad.com.

