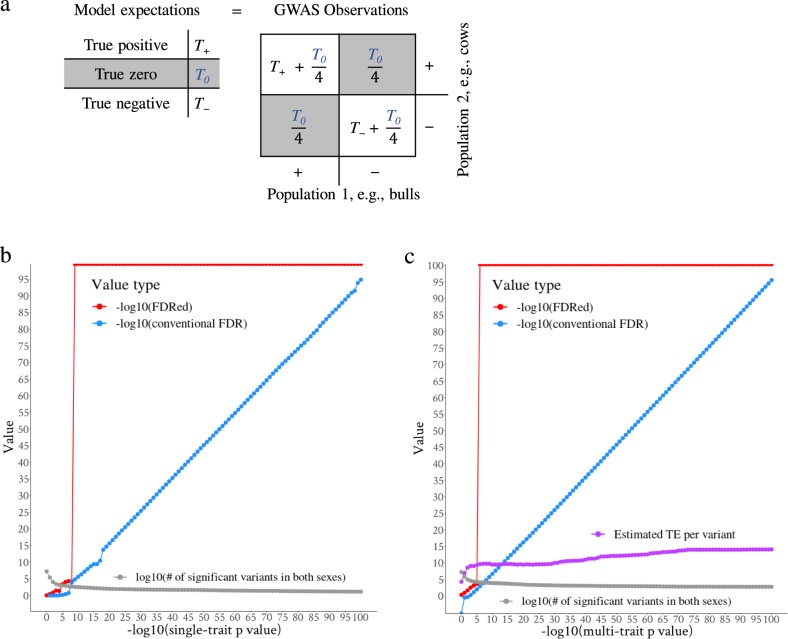
Fig. 2. The graphical representation of the EDME model and false-discovery rate (FDR).
a The model expectations of true positive, zero and negatives in the left panel are equated with the observation of variant effect directions (the number of ‘++’ in the first quadrant, ‘−+’ in the second quadrant, ‘+−’ in the third quadrant and ‘−−’ in the fourth quadrant) of GWAS in two populations (e.g., bulls and cows). The grey boxes indicate the first solvable equation where the number of (‘−+’ and ‘+−’) = . b Distribution of FDR effect direction (FDRed) and the conventional FDR for a range of single-trait p value thresholds imposed for both sexes. At each p value point, the mean of FDR and its standard error across 34 CT traits were given. The single-trait FDRed was based on the proportion of variants with inconsistent effect directions between sexes (Eq. 3). The grey line indicates the number of variants significant in both sexes at each p value threshold. c Distribution of FDRed and conventional FDR for a range of multi-trait p value thresholds imposed for both sexes (grey line). The multi-trait FDRed was based on the dot product (Π) of the variant effects (beta/s.e.) from two sexes (Eq. 5). Using the count of variants with consistent effect directions across multiple traits, EDME estimates the number of true effects (TE) averaged across a selection of variants (Eq. 7).

