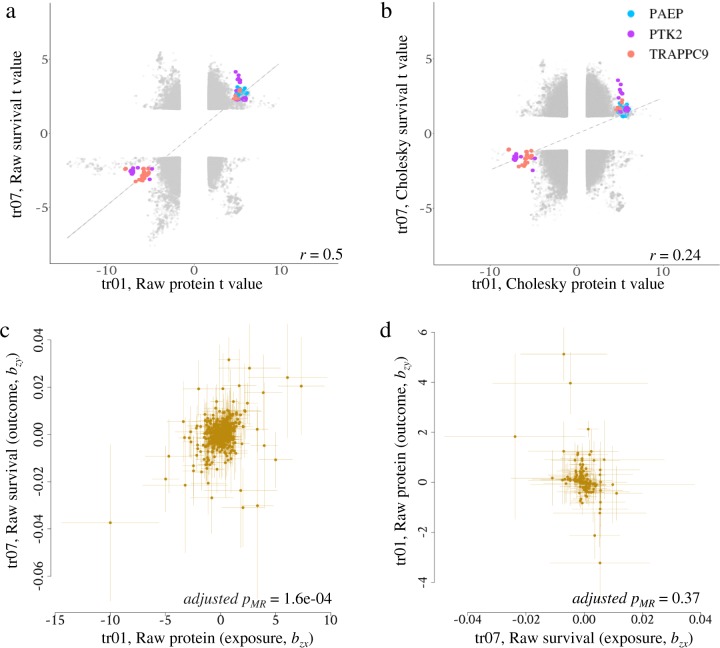
Fig. 5. An example of the putative causal association between protein (trait 01) and raw survival (trait 07).
a scatter plot of GWAS t (b/se) value of raw traits of protein and survival. Correlation (r) of effects between traits were indicated. b Scatter plot of GWAS t (b/se) value of Cholesky traits of protein and survival. c Plot of effect sizes of forward Mendelian Randomisation using raw trait protein as exposure (x, causal variable), raw trait survival as outcome (y, effect variable) and non-pleiotropic variants as instrumental variables (z)20. Bonferroni multi-testing adjusted p value of Mendelian Randomisation (pMR) is indicated. d Plot of effect sizes of reverse Mendelian Randomisation using raw trait survival as the exposure and raw trait protein as the outcome.

