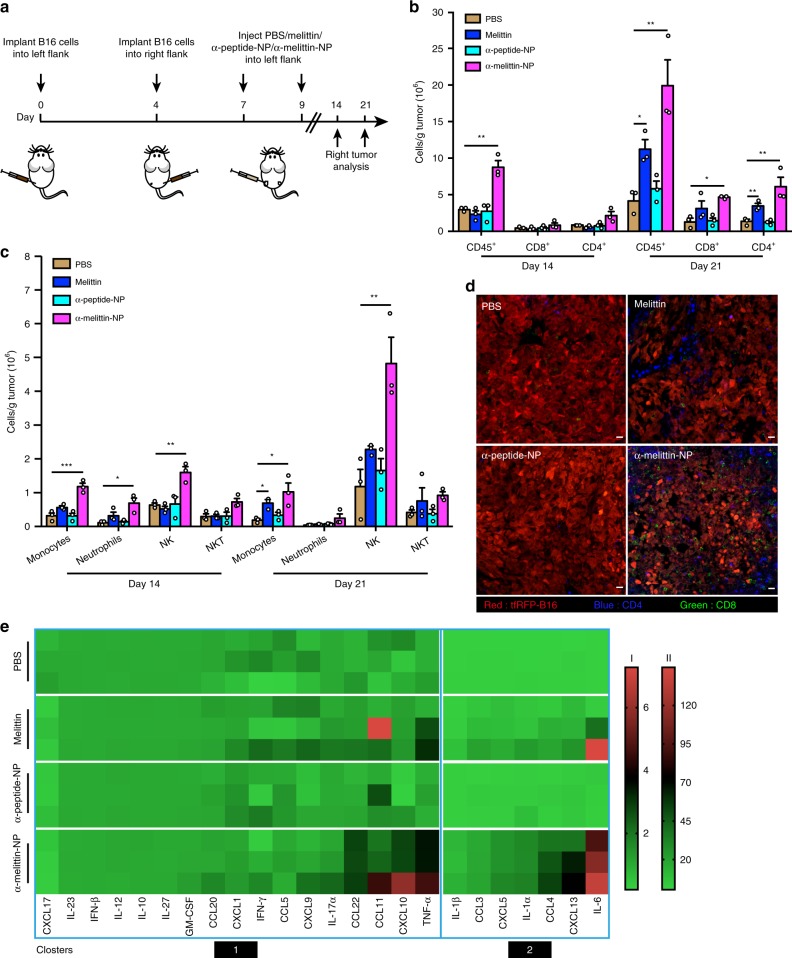
Fig. 6. α-melittin-NPs induce the lymphocyte infiltration and dramatic changes in the cytokines/chemokines milieu in distant tumor.
a Treatment scheme. b, c Absolute numbers of adaptive immune cells (b) and innate immune cells (c) in the distant tumor (n = 3 per group per time point) were calculated from flow cytometry at 14 and 21 days after left tumor implantation. d Immunofluorescence images from distant tumors 21 days after left tumor implantation. Red: tfRFP-B16F10, blue: CD4+ T cell, green: CD8+ T cell. Representative images from three independent experiments are shown. Scale bar, 20 μm. e The levels of cytokines/chemokines in the tumor environment (n = 3 per group). According to the fold change relative to the untreated group, the expression levels of cytokines and chemokines were divided into two clusters. Clusters 1 and 2 share bars I and II, respectively. Data are shown as the mean ± SEM. n.s. not significant, *P < 0.05, **P < 0.01 and ***P < 0.001, as analyzed by one-way ANOVA with Bonferroni’s post hoc (b, c). Source data are provided as a Source Data file.

