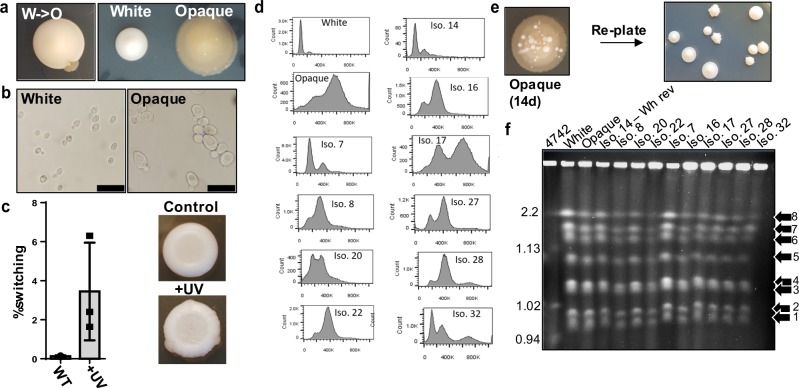
Fig. 1. Measurements of white-to-opaque and opaque-to-white switching and DNA content analysis in T. microellipsoides.
a Example images of white-to-opaque sector-based switching (left) and adjacent white and opaque colonies (right). b Phase-contract microscopy images of white and opaque cells at ×1000 magnification. c Quantification of white-to-opaque switching under standard conditions and after UV-treatment; N = 3 independent experiments. An example of untreated and UV-treated cells are shown on the right, with opaque sectors denoted by arrows. d DNA content analysis of white, opaque, and ten opaque cell derivatives (including a white cell revertant, Iso 14), as measured by flow cytometry. e Example image of reverse switching of an opaque colony (left), and colonies derived from re-plating the same colony (right). f CHEF gel analysis of chromosome banding pattern of white, opaque, and ten opaque cell derivatives (including a white cell revertant, Iso 14). S. cerevisiae BY4742 denotes size standards. Error bars represent the standard deviation of the mean; significance values are shown in Supplementary Data 1.

