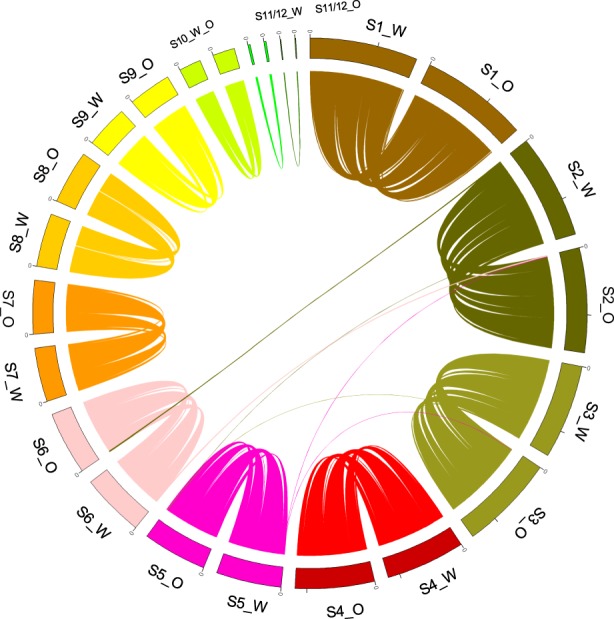
Fig. 2. Genomic comparison of white and opaque cells shown in a Circos plot, comparing assemblies of T. microellipsoides white and opaque cells at the scaffold level.

White and opaque cell scaffolds are represented by the letters S#_“W” and “O” (Scaffold Number White/Opaque), respectively. Links represent matching sequences of at least 1 kb in length and 70% sequence identity and are coloured based on their scaffold of origin. Most scaffolds sequences are similar between assemblies. Possible translocation events are represented by pairs of links, more precisely from chr w 2 to chr o VI, chr w 2 to chr o V, chr w 5 to chr o III, and their respective counterparts.
