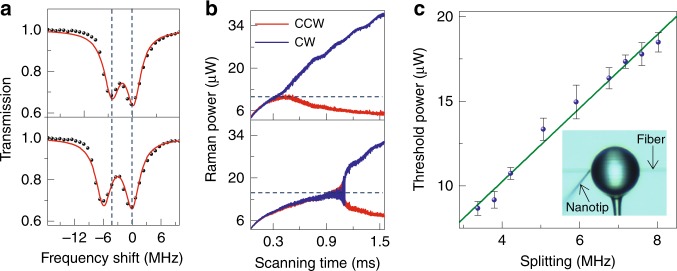
Fig. 4. Symmetry-breaking threshold.
a Transmission spectra of Raman modes with a smaller (top) and a larger (bottom) splitting controlled by a side-coupled scatterer, respectively. The black dots (red curves) are the measured (fitted) results, manifesting the two standing-wave supermodes featured by the double lorentzian dip. b Raman emission in CW and CCW directions with a smaller (top) and a larger (bottom) Raman mode splitting controlled by a side-coupled scatterer, respectively. c The threshold power for Raman chirality exhibits a linear dependence on the splitting in the Raman modes, where the green line is the fitting result. The error bars represent the standard deviation of repeated measurements. Inset: A silica nanotip (left side) is placed in the evanescent field of a microsphere to change the Rayleigh scattering strength.

