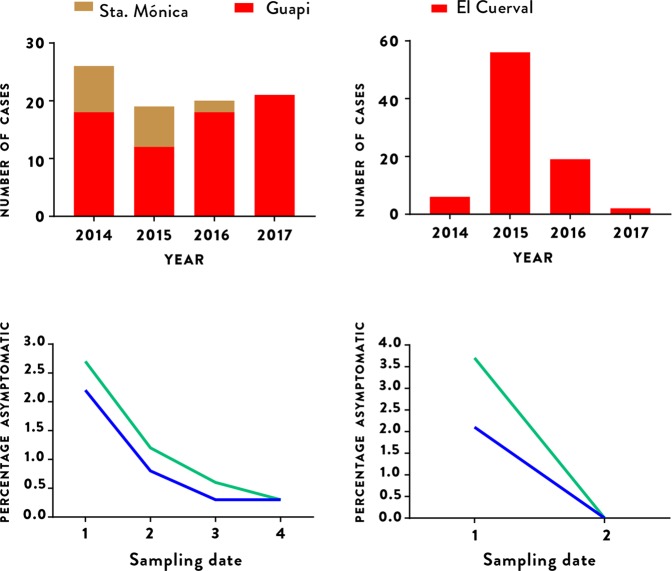
Figure 5.
The relationship between asymptomatic individuals and malaria incidence in Guapi (left column) and El Cuerval (right column). Asymptomatic individuals found to have parasitemia during the study period by microscopy (blue line) or PCR (green line) at different time points (lower row) and the number of cases diagnosed during routine surveillance in the town of Guapi (red bars) and in the Santa Mónica neighborhood of Guapi (mustard bars) and El Cuerval (red bars, upper row). Asymptomatic individuals in Guapi were sampled in four occasions in the Santa Mónica neighbourhood (1: April (2015), 2: October (2015), 3: April (2016), 4: October (2016) (see Methods)) and are represented as a fraction (brown) of the total cases (red) in the town of Guapi. Asymptomatic prevalence by PCR in Guapi were: 1: April-2015 [6/226 (2.7%); CI 95%: 0.9-5.8], 2: October (2015) [3/250 (1.2%); CI 95%: 0.2–3.5], 3: April (2016) [2/298 (0.6%); CI 95%: 0.1-2.4], 4: October (2016) [1/303 (0.3%); CI 95%: 0.1–1.9]. Asymptomatic prevalence by microscopy in Guapi were: 1: April (2015) [5/226 (2.2%); CI: 0.01–5.1], 2: October (2015) [2/250 (0.8%); CI 95%: 0.2–2.9], 3: April (2016) [1/298 (0.3%); CI 95%: 0.1–1.9], 4: October (2016) [1/303 (0.3%); CI 95%: 0.1–1.9]. In El Cuerval two sampling events were performed at time points with different malaria incidence (1: December, 2015, 2: May, 2017). As the number of cases diminishes so does the number of asymptomatic individuals with parasitemia. Asymptomatic prevalence by PCR in El Cuerval were: 1: December, 2015 [7/188 (3.7%); CI 95%: 1.5–7.7], 2: May, 2017 [0/103 (0%); CI 95%: 0–1.2]. Asymptomatic prevalence by microscopy in EL Cuerval were: December, 2015 [4/188 (2.1%); CI 95%: 0.8–5.3], 2: May, 2017 [0/103 (0%); CI 95%: 0–1.2]. CI = Confidence Interval.

