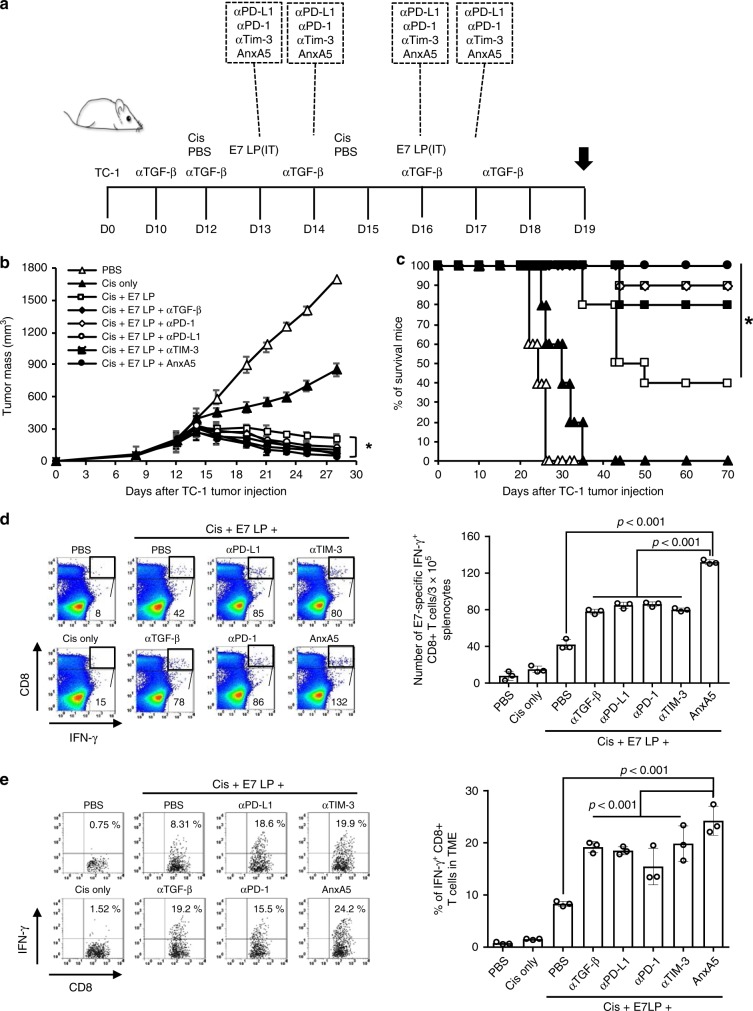
Fig. 4. Antitumor efficacy of Annexin A5 versus other immune checkpoint inhibitors.
C57BL/6 mice were injected with 2 × 10⁵ TC-1 cells/mouse subcutaneously on day 0. Mice were then treated intraperitoneally with 200jig/mice α-TGF-f3 on day 10, 12, 14, 16, and 18, intraperitoneally with 5 mg/kg Cisplatin on days 12 and 15, intravenously with 200jig/mice of Annexin A5 proteins on days 13, 14, 16, and 17, intraperitoneally with 200jig/mice of α-PD-1, α-PD-L1, or α-TIM-3 on days 13, 14, 16, and 17, and/or intratumorally with 20jig/mice of E7 long peptide on days 13 and 16. PBS and irrelevant IgG were used as controls. The treatment groups are as follows: opened triangle - PBS only; closed triangle - cisplatin only; opened square—cisplatin and E7 long peptide; closed sphere—cisplatin, E7 long peptide, and anti-TGF-f3; opened sphere—cisplatin, E7 long peptide, and anti-PD-1; opened circle—isplatin, E7 long peptide, and anti-PD-L1; closed square—cisplatin, E7 long peptide, and anti-TIM-3; closed circle—cisplatin, E7 long peptide, and Annexin A5. a Schematic diagram. b Line graph depicts TC-1 tumor growth in different treatment groups over time (n = 10). P-values were determined by one-way ANOVA and Turkey’s test. c Kaplan–Meier survival analysis of TC-1 tumor-bearing mice in different treatment groups (n = 10), and the overall P-value was calculated by the log-rank test. d, e On day 19, spleens and tumor tissues of TC-1 tumor-bearing mice in different treatment groups were harvested and analyzed for CD8+IFN-γ+ T cells by flow cytometry analysis. d Representative flow cytometry analysis and bar graph depicting the abundance of CD8+IFN-γ+ T cells in splenocytes of TC-1 tumor-bearing mice in different treatment groups (n = 3). e Representative flow cytometry analysis and bar graph depicting the abundance of CD8+IFN-γ+tumor-infiltrating T cells in TC-1 tumor-bearing mice in different treatment groups (n = 3). The error bars indicate mean ± SD. For d, e, P-values were analyzed by Student’s t test. The results are representative of one of three independent experiments. Source data are provided as a Source Data file.

