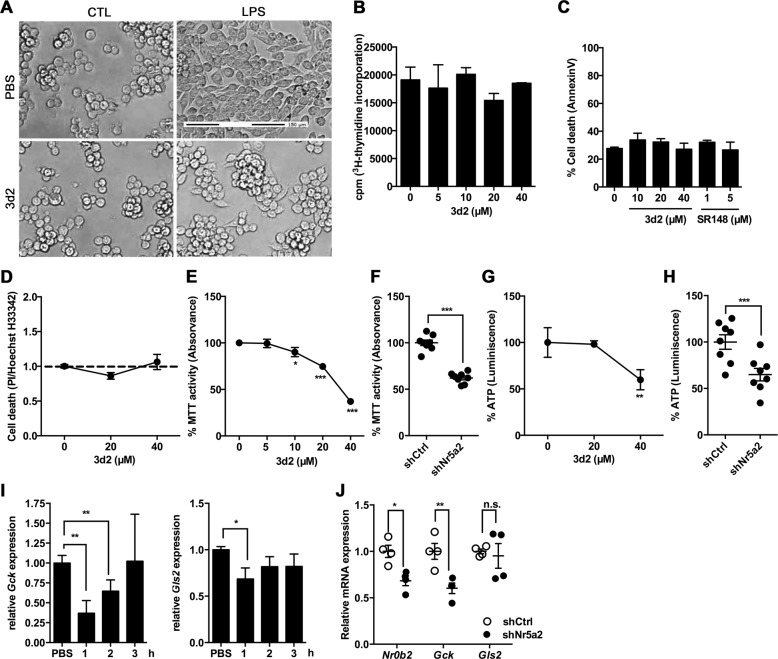
Fig. 4. LRH-1 inhibition reduces mitochondrial activity in RAW 264.7 cells.
a Representative microscopy images of RAW 264.7 cells pre-incubated for 2 h with 3d2 (40 μM) or vehicle (PBS), prior to stimulation with control buffer (CTL) or LPS (30 ng/ml) for 18 h (scale bar: 150 μm). b [3H]thymidine incorporation as representative of proliferation rate of RAW 264.7 cells after treatment with 3d2 at indicated concentrations. Results shown as radioactive-dependent scintillation counts per minute (c.p.m.). c Cell death analysis (AnnexinV staining) in 3d2- or SR1840-treated cells. d Cell death detection by propidium iodide (PI):Hoechst dye (H33342) ratio in 3d2-treated RAW 264.7 cells. Values have been normalized to untreated cells (dashed line). Mean values of triplicates ± SD of a representative experiment (n = 3) are shown. e MTT assay analysis of the general mitochondrial activity and g ATP levels in RAW 264.7 cells after overnight treatment with 3d2 at the indicated concentrations. Results are shown as normalized data to the untreated control. Mean values of triplicates ± SD of a representative experiment (n = 3) are shown (one-way ANOVA ***p < 0.001). f MTT assay analysis and h ATP levels in RAW 264.7 cells transduced with shRNA against Nr5a2 (shNr5a2) or shRNA control (shCtrl), and shown as relative to untargeted controls (shCtrl). Technical replicates ± SD of a representative experiment (n = 3) are shown (t test, ***p < 0.001). i mRNA expression levels of Gck and Gls in RAW 264.7 cells after treatment with vehicle (PBS) or 3d2 (40 μM) at indicated time points. j mRNA levels of Nr0b2 (SHP), Gck, and Gls2 in RAW 264.7 cells transduced with shRNA against Nr5a2 (shNr5a2) or shRNA control (shCtrl). Results are shown as relative to murine βactin mRNA expression and normalized to untreated or untargeted controls. i Mean values of triplicates or j technical replicates ± SD of two independent experiments are shown (one-way ANOVA (i) or t test (j), *p < 0.05, **p < 0.01, n.s. = not significant).

