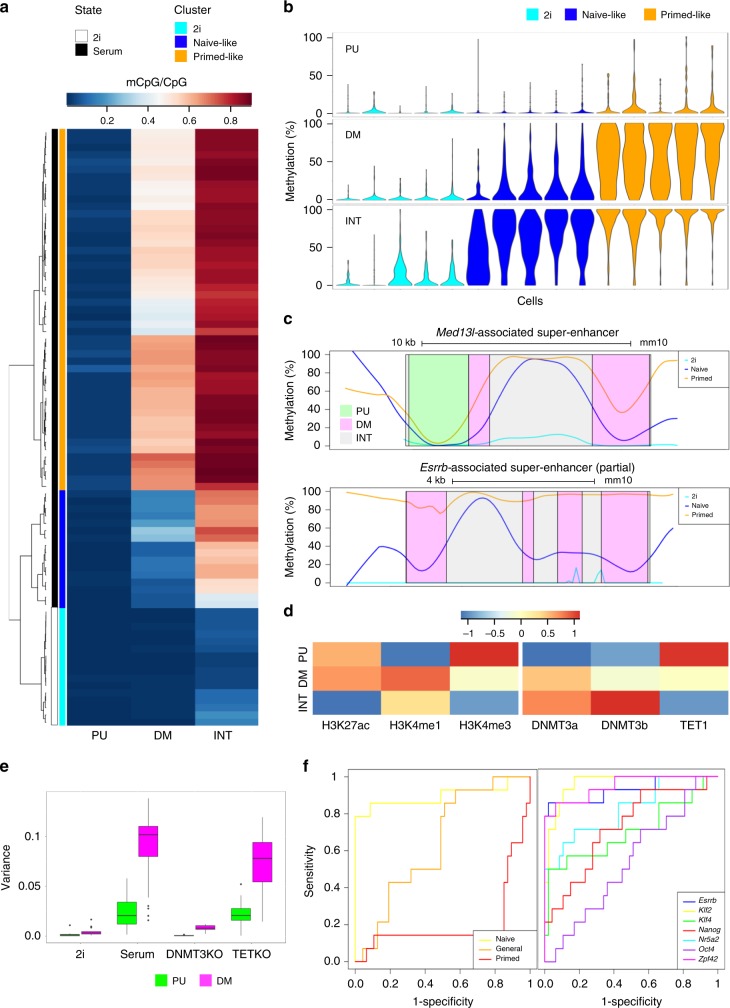
Fig. 4. Contrasting CpG methylation dynamics at PU and DM subregions in individual ESCs.
a CpG methylation levels (mCpG/CpG) at PU, DM and INT SE subregions in 16 individual ESCs grown in 2i/LIF (2i, white) and 64 ESCs grown in serum/LIF30 (serum, black). Each row represents one single cell, with blue–red colour gradient indicating proportion of methylated CpGs in the corresponding SE subregion class. Using hierarchical clustering, three cell clusters are identified: 2i (light blue), “naive-like” (blue) and “primed-like” (orange) serum-ESCs. b Violin plots representing the distribution of the average methylation (%) across SE subregions for five randomly selected single cells in each of the three single-cell clusters defined in a. c Profiles of CpG methylation levels throughout the Med13l- (class I) and Esrrb-associated (class II) SEs with indication of PU (light green), DM (pink) and INT (grey) subregions. Each line gives the lowest-smoothed average of each individual CpG methylation across all individual cells in the corresponding cluster: 2i cluster (light blue), “naive-like” cluster (blue) and “primed-like” cluster (orange). d Heatmaps showing the relative levels of enrichment (median log2 fold change of ChIP-seq signal (RPKM + 1) over input signal (RPKM + 1)) for selected histone marks (left panel) and CpG methylation regulators (right panel) at PU, DM and INT subregions in bulk ESCs grown in serum/LIF. Enrichment scores for each feature are scaled by dividing by the mean enrichment score for that feature across all subregions. See Supplementary Data 1 for dataset accession numbers. e Box plots representing the distribution of methylation variances across PU (green) and DM (magenta) subregions for each individual cell analysed in different treatment conditions (2i and serum wild-type ESCs, and Dnmt3a/b DKO and Tet1-3 TKO ESCs grown in serum/LIF)30,31. f Receiver operating characteristic (ROC) curves comparing the performance of naive (yellow), general (orange) and primed (red) pluripotency gene sets in discriminating “naive-like” and “primed-like” cell clusters based on the average of their normalised expression levels (left panel). ROC curves comparing the performance of individual naive pluripotency genes (discriminating “naive-like” and “primed-like” cell clusters based on normalised expression level), illustrating Esrrb, Klf2 and Zfp42 as best classifiers of “naive-like” and “primed-like” clusters (AUC values = 0.928, 0.963 and 0.948 respectively; p = 10−5; right panel).

