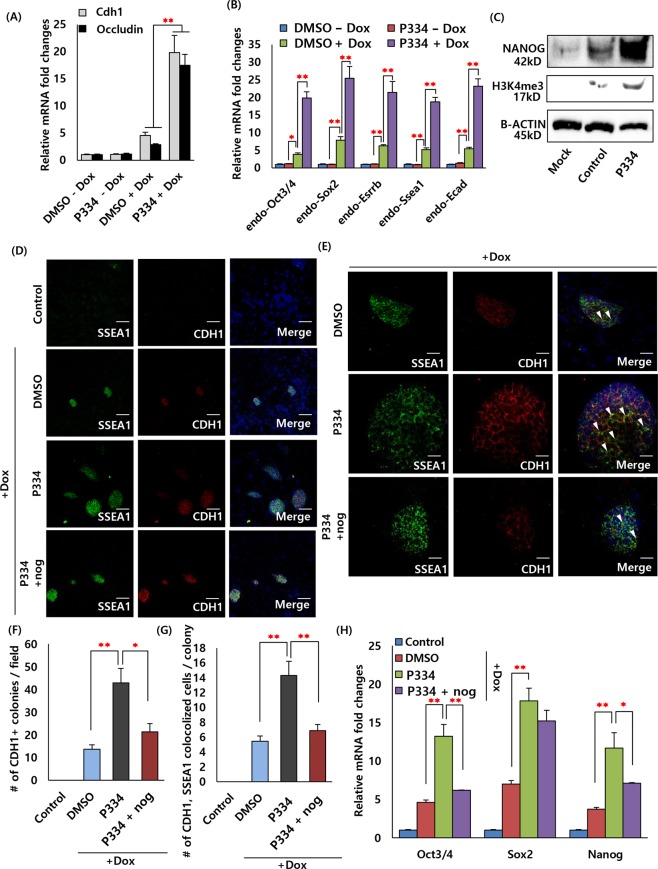
Figure 4.
MET process with epigenetic changes associated with somatic cell reprogramming induced by P334. (A) RT-PCR analysis of MET genes following reprogramming in control and P334 treated after dox induction (data represent mean ± SEM. **p < 0.01). (B) RT-PCR analysis of pluripotent markers Oct3/4, Sox2, Esrrb, Ssea1 and E-cadherin (Cdh1) in OSKM-infected fibroblasts with and without P334 treated at 15 days after dox induction (data represent mean ± SEM. *p < 0.05, **p < 0.01). (C) Western blot analysis of histone 3 lysine 4 tri-methylation (H3K4me3) and NANOG of 4 factors infected fibroblasts reprogramming in control and P334 treated batch. (D) Immunostaining analysis showing the expression of pluripotency markers, SSEA1 and CDH1, in OSKM-infected fibroblasts with and without P334 and noggin (nog) treated at 15 days after dox treated. (Scale bar: 150 um) (E) Immunostaining analysis showing the co-localization of pluripotency markers, SSEA1 and CDH1, in OSKM-infected fibroblasts with and without P334 and nog treated at 15 days after dox treated. More amount of co-localized cells were observed in P334 treated batch. However, lowered amount of co-localized cells were measured in nog treated batch. (White triangle showing the co-localized cells in single iPSC colony.) (Scale bar: 30 um) (F) Bar graph representing the number of CDH1 positive iPSC colonies per field (data represent mean ± SEM. *p < 0.05, **p < 0.01). (G) Bar graph representing the number of co-localized CDH1 and SSEA1 positive cells in single iPSC colony (data represent mean ± SEM. **p < 0.01). (H) QRT-PCR analysis of pluripotency genes (Oct3/4, Sox2 and Nanog) in OSKM-infected fibroblasts with and without P334 and nog treated (data represent mean ± SEM. *p < 0.05, **p < 0.01). Data is analyzed at 15 days after dox induction.

