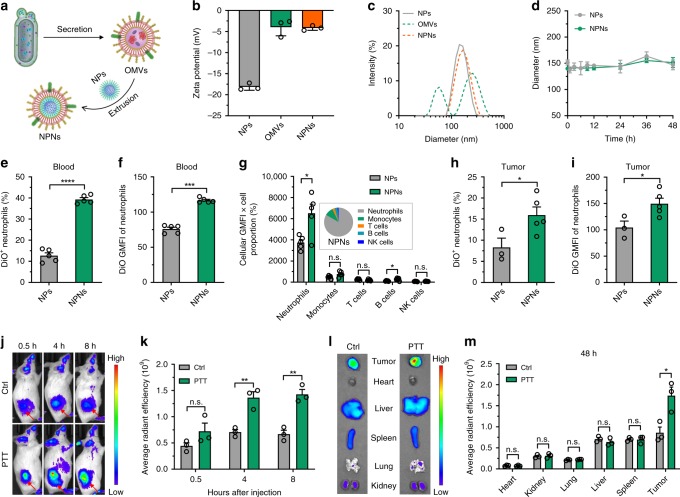
Fig. 5. Pathogen-mimicking NPNs hitchhiked circulating neutrophils and homed to inflamed tumors.
a Schematic showing the preparation of NPNs. b Zeta potential and c size distribution of NPNs before and after coating with OMVs. n = 3 biologically independent samples per group. d Stability of NPNs compared to PEG-b-PLGA NPs in medium containing 10% mouse serum. n = 3 per group. e–i DiO-labeled NPs and NPNs were i.v injected into PTT-treated EMT6-bearing mice. After 4 h, the percentage of neutrophils with NPs in the blood and tumor were analyzed by flow cytometry. e Percentage of DiO+ neutrophils and f DiO GMFI of neutrophils in blood were analyzed by flow cytometry. n = 5 per group. g Distribution of DiO-labeled NPs and NPNs in different immune cells in blood as defined by multiplying the percentage of immune cells with cellular GMFI of DiO. The inset showed the relative distribution of NPNs in the major immune cell types in blood as calculated using the following equation (GMFIx × percentagex)/Σ(GMFIx × percentagex), “x” represents neutrophils, monocytes, T cells, B cells, or NK cells. n = 5 per group. h Percentage of DiO+ neutrophils and i DiO GMFI of neutrophils in tumors were analyzed by flow cytometry. n = 3 for the NPs group and n = 5 for the NPNs group. j–m DiD-labeled NPNs were i.v. injected into control or PTT-treated EMT6-bearing mice. n = 3 per group. j At different time points, in vivo DiD fluorescent signals were observed with IVIS. k Quantitative ROI analysis of DiD fluorescent signals in tumor areas. l At 48 h after injection, the tumors and major organs were collected and fluorescent images were acquired with IVIS. m Quantitative ROI analyses of DiD signals in tumors and organs. Data are shown as mean ± SD (b, d) or mean ± SEM (e–i, k, m), and analyzed by unpaired two-tailed Student’s t-test. *P < 0.05, **P < 0.01, ***P < 0.001, ****P < 0.0001. n.s. not significant. Source data are provided as a Source Data file.

