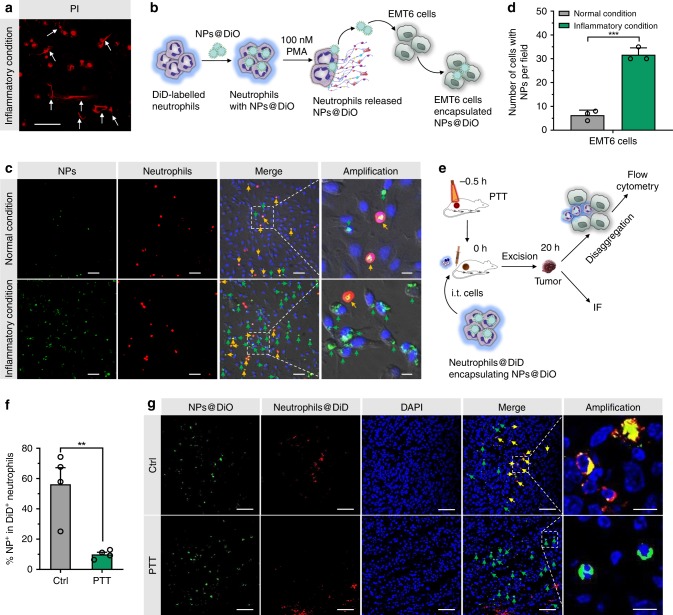
Fig. 6. Tumor cells internalized NPs that were released from neutrophils under inflammatory conditions.
a Confocal fluorescent images of propidium iodide (PI)-stained neutrophils cultured under inflammatory conditions (100 nM PMA) for 5 h. Scale bar, 50 μm. Data are representative of two independent experiments. b Workflow of neutrophils and EMT6 co-culture assay. DiD-labeled neutrophils were incubated with DiO-labeled PEG-b-PLGA NPs (NPs@DiO) for 1 h. The obtained neutrophils were co-cultured with EMT6 cells followed by nucleus staining and microscopy imaging. c Confocal fluorescent images of co-cultured EMT6 cells and neutrophils. Yellow arrows indicated neutrophils with NPs and green arrows indicated EMT6 cells with NPs. Scale bars, 10 μm for the amplification panels, and 50 μm for all the other panels. Data are representative of three biological replicates. d Number of EMT6 cells that internalized NPs under inflammatory and normal conditions. n = 3 biologically independent samples per group. e Schematic showing analyses of tumors that internalized NPs released from neutrophils in untreated or photothermally treated EMT6 tumors. EMT6-bearing mice were left untreated or were i.v. injected with NPs@PBT on −12 h and tumors were performed with PTT (40 °C for 5 min) on −0.5 h. DiD-labeled neutrophils were incubated with DiO-labeled PEG-b-PLGA NPs and intratumorally (i.t.) injected into the mice at 0 h. After 20 h, DiO fluorescent signals were analyzed by flow cytometry and IF. f The percentage of transferred neutrophils containing NPs (defined as NP+DiD+) was detected by flow cytometry. n = 4 mice per group. g DiO signals in transferred neutrophils and EMT6 tumor cells were analyzed by IF. Yellow and green arrows indicated NPs@DiO that were co-localized and not co-localized with neutrophils, respectively. Scale bars, 10 μm for the amplification panels, and 50 μm for all other panels. Data are representative of three biological replicates. Data are shown as mean ± SD (d) or mean ± SEM (f), and analyzed by unpaired two-tailed Student’s t-test. **P < 0.01, ***P < 0.001. Source data are provided as a Source Data file.

