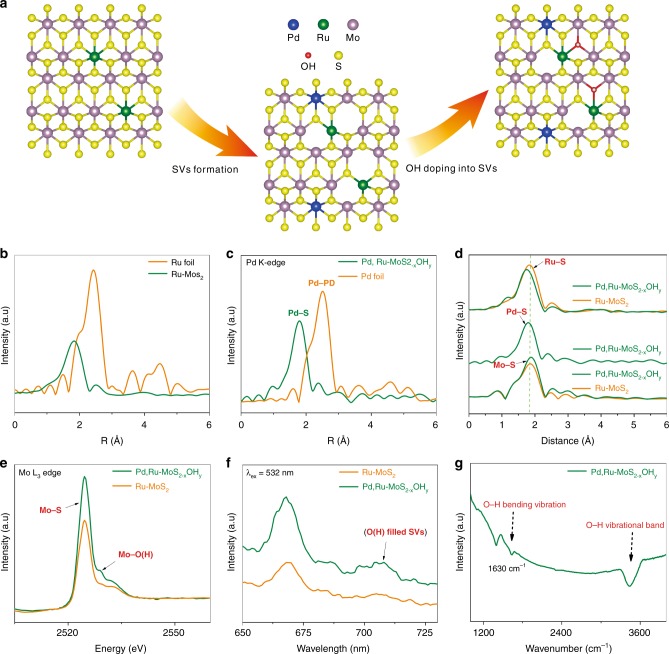
Fig. 1. Schematics for the O filled S vacancies (SVs).
a Schematics for the synthesis strategy of Pd, Ru dual-doped MoS2–xOHy phase. Blue, yellow, purple, green and red spheres represent Pd, S, Mo, Ru, and O atoms, respectively. b Fourier transform of the k2-weighted Ru K-edge EXAFS spectra. c Fourier transform of the k2-weighted Pd K-edge of EXAFS spectra. d Fourier transform of the k2-weighted Pd K-edge, Ru K-edge and Mo K-edge EXAFS spectra. e Mo L3-edge XANES spectra of Ru-MoS2 and Pd, Ru-MoS2−xOHy. f Photoluminescence spectra of Ru-MoS2 and Pd, Ru-MoS2−xOHy. g FTIR spectra of Pd, Ru-MoS2−xOHy.

