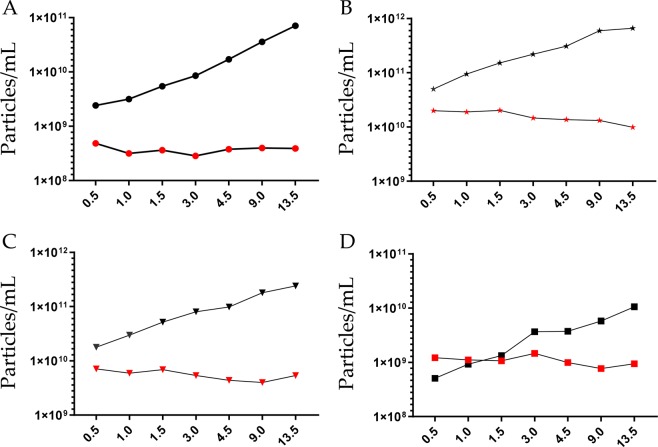
Figure 3.
Particle size distribution and concentration. (A) Tunable resistive pulse sensing of P21 pellet; (B) Nanoparticle tracking analysis (NTA) of P21 pellet; C NTA of P21TCEP pellet and (D) P21TCEP supernatant. Black marks represent the particle concentration of re-solubilized pellet, red marks refer to the particles concentration per mL of urine. X- axis represent volume of urine (mL) processed to obtain the uEV pellet. Pellets for TRPS were re-solubilized in 100 μL of PBS-0.1μm (A). Pellets for NTA were resolubilized in 200 μL of 10 mM Tris-HCl pH8.8 + 4 mM TCEP- for P21 (B) and P21TCEP (C) pellets and 1.2 mL 110 mM Tris-HCl pH8.8 + 4 mM TCEP for SN21TCEP (D).

