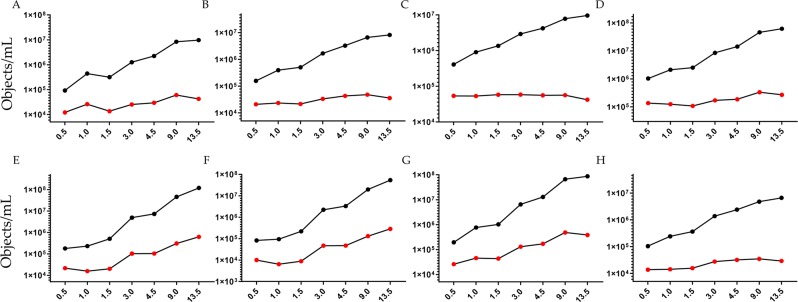
Figure 5.
Imaging flow cytometry quantification. Concentration obtained by gating positive events (Supplementary Fig. S13) of: (A) IGFBP7; (B) TIMP2; (C) TMEM27; (D) AnnexinV; (E) Autofluorescence emission in channel 5; (F) Auto fluorescence emission in channe 11; (G) PODXL (F) PODXL without autofluorescence excluded applying the Boolean or logic function: “Not AF gate Ch5 And Not AF gate Ch11”. Black marks particles concentration of re-solubilized pellets, red marks particles concentration per mL of urine. X-axis shows the volume of urine (mL) processed to obtain the uEVs pellet.

