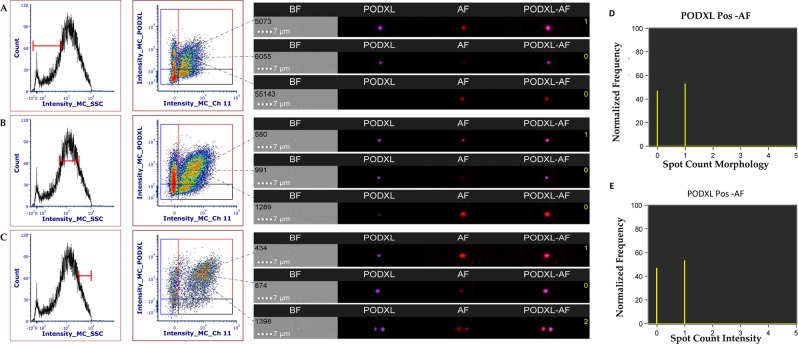
Figure 6.
Imaging flow cytometry quantification single staining for PODXL. Co-detection of PODXL and AF emission in channel 11 at low (A), medium (B) and high (C) scatter based on the gate strategy in Supplementary Fig. S19. Application of morphology (D) and intensity (E) masks combined with the spot count feature show the number of coincidence event. Yellow digits in the image gallery indicate the number of events calculated by the spot feature.

