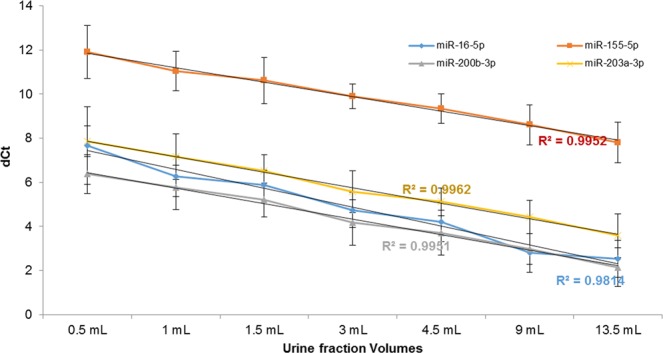
Figure 7.

Real time quantitative PCR (qPCR) analysis of P21 pellet. RNA from the whole P21 pellet - originated from different volumes - was isolated and reverse-transcribed. qPCR analysis for miR-16 (blue), miR-155 (red), miR-200b (gray), and miR-203 (yellow) was performed and the relative cycle threshold values (dCt) were plotted for each of the volumes. The trend line with the R2 value indicates that the amount of miRNA increased with the increased volume of urine used for processing the pellet.
