
Fig. 7. CCR5 and CCR8 but not CXCR3 contribute to homing of lymph-derived activated CD4 T cells to LNs.
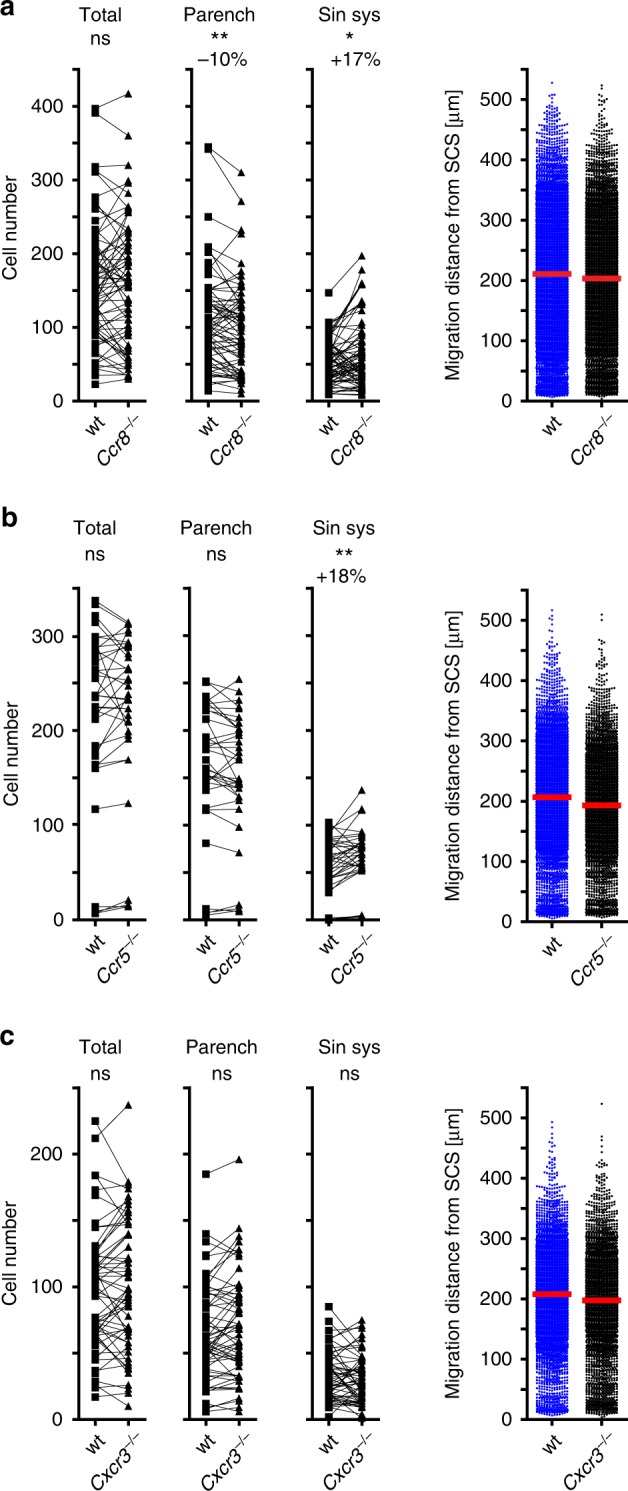
Quantitative analysis of adoptively transferred cells in popliteal LNs 90 min after i.l. injection of combinations of activated CD4+ T cells as indicated; a wild type and Ccr8−/−; b wild type and Ccr5−/−; c wild type and Cxcr3−/−. Left, total cell counts; dots represent cell counts per LN section; numbers above indicate the percentage of change compared to control cell population (parench parenchyma; sin. sys. sinus system). Right, migration distance from the SCS; dots represent the shortest distance of each cell to the SCS; red bars, median; ns, not significant; Wilcoxon signed rank test; *p < 0.05; **p < 0.01. Data are derived from three experiments with a total of nine (a) or eight (c) mice, or from two experiments with a total of five (b) mice.