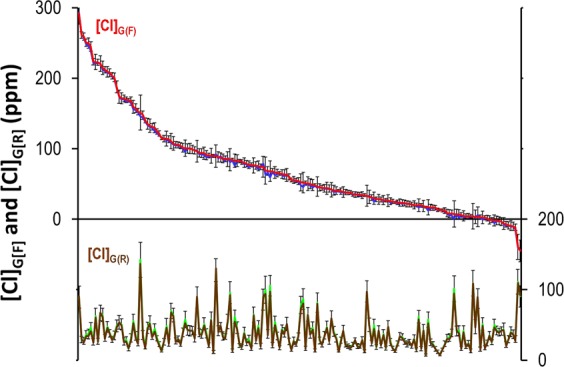
Figure 6.

Contribution of rain [Cl]G(R) (brown line) and fertilizers [Cl]G(F) (red line) to the Cl concentration in groundwater in each tube wells of the Berambadi Catchment (ranked by decreasing [Cl]G(F)) calculated using the average [Na]w in the forested catchment. The blue and green lines show respectively the average of [Cl]G(R) and [Cl]G(F) calculated using 20 random values spanning the range of the natural variability and error bars show the standard deviation.
