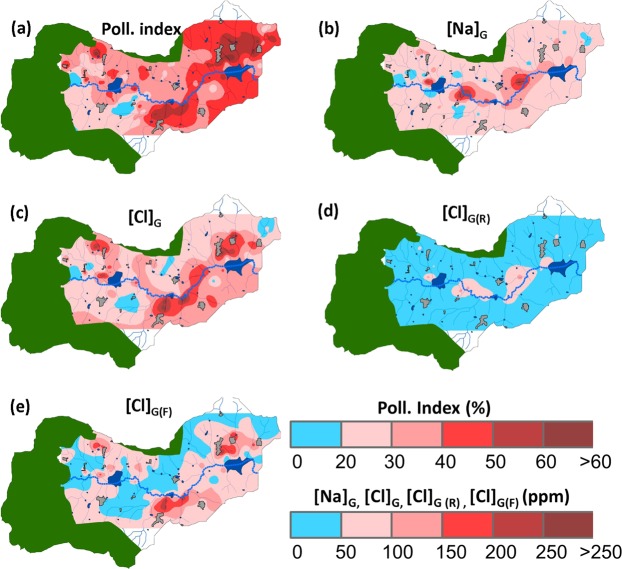
Figure 7.
Spatial distribution of groundwater quality in the Berambadi catchment: (a) pollution index, concentration (ppm) in groundwater of (b) Sodium, (c) Chloride, (d) Contribution of rain [Cl]G(R) and (e) fertilizers [Cl]G(F). The green, dark blue and grey colours show forest, ponds and settlements respectively, the dotted blue line shows the main stream (maps were generated using ArcGIS version 10.3.0, https://desktop.arcgis.com/en/).

