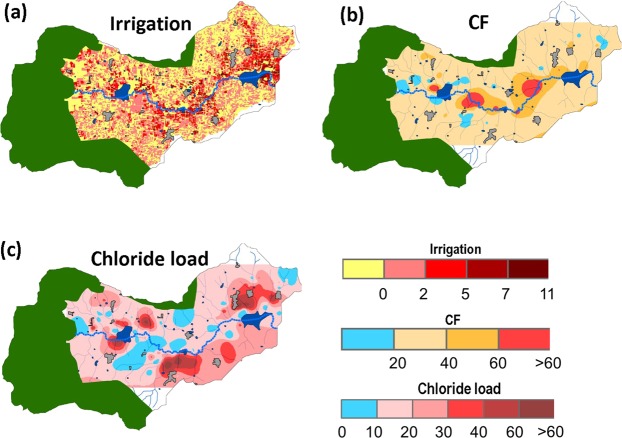
Figure 8.
Spatial variations of (a) number of irrigation occurrences from 1990 to 2013 using satellite imagery (See methods) (b) Concentration factor due to evapotranspiration (CF, dimensionless) in the Berambadi catchment and (c) Chloride load (kg Cl. ha−1. y−1) originating from fertilizers. The green, dark blue and grey colours show forest, ponds and settlements respectively, the dotted blue line shows the main stream (maps were generated using ArcGIS version 10.3.0, https://desktop.arcgis.com/en/).

