
Figure 4.
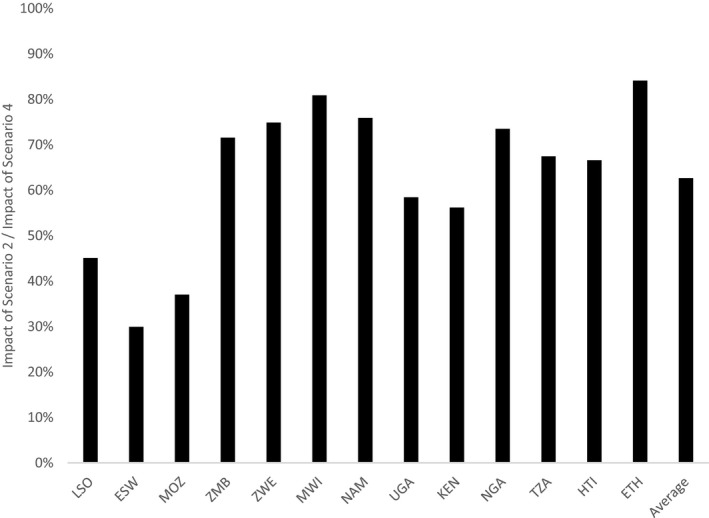
Impact of focused oral PrEP rollout to FSWs and SDCs relative to expanded rollout to FSWs, SDCs and AGYW (nationally). The graph shows the impact (HIV infections averted) of focused rollout to FSWs and SDCs (Scenario 2) divided by the impact of an expanded rollout to FSWs, SDCs and medium‐risk AGYW in all regions (Scenario 4). ESW, Eswatini; ETH, Ethiopia; HTI, Haiti; KEN, Kenya; LSO, Lesotho; MOZ, Mozambique; MWI, Malawi; NAM, Namibia; NGA, Nigeria; TZA, Tanzania; UGA, Uganda; ZMB, Zambia; ZWE, Zimbabwe.