
Figure 5.
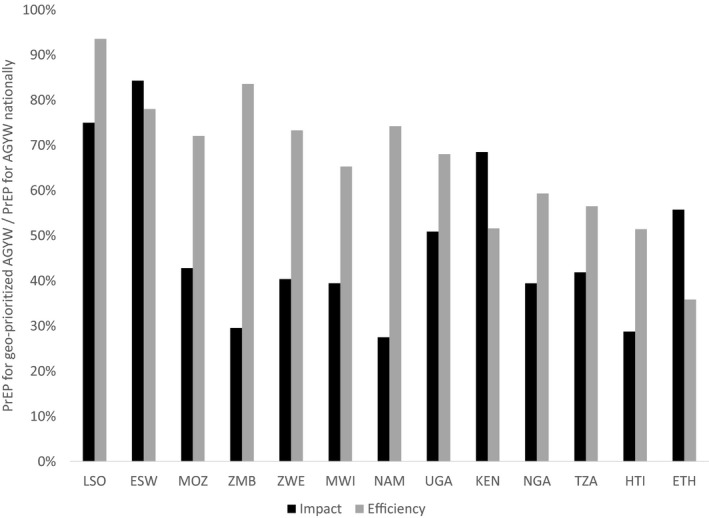
Impact and efficiency of geographically prioritized rollout of oral PrEP for AGYW relative to national rollout for AGYW. The graph shows the impact (HIV infections averted) and efficiency (person‐years of oral PrEP per HIV infection averted) of geographically prioritized rollout of oral PrEP to medium‐risk AGYW in regions with higher than median HIV incidence divided by those same metrics for oral PrEP rollout to medium‐risk AGYW in all regions. AGYW, adolescent girls and young women; ESW, Eswatini; ETH, Ethiopia; HTI, Haiti; KEN, Kenya; LSO, Lesotho; MOZ, Mozambique; MWI, Malawi; NAM, Namibia; NGA, Nigeria; PrEP, pre‐exposure prophylaxis; TZA, Tanzania; UGA, Uganda; ZMB, Zambia; ZWE, Zimbabwe.