
Figure 8.
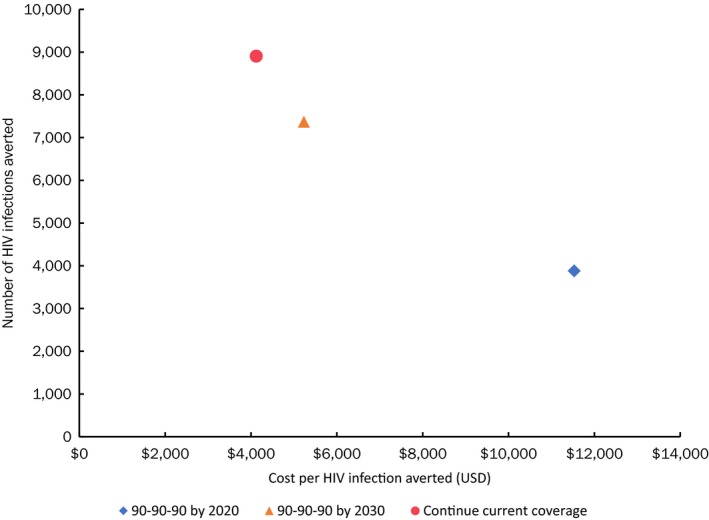
Number of HIV infections averted and cost per infection averted due to oral PrEP scale‐up (Scenario 4, rollout to FSWs, SDCs and medium‐risk AGYW in all regions) from 2018 to 2030 by treatment scenario.
Official websites use .gov
A
.gov website belongs to an official
government organization in the United States.
Secure .gov websites use HTTPS
A lock (
) or https:// means you've safely
connected to the .gov website. Share sensitive
information only on official, secure websites.
Number of HIV infections averted and cost per infection averted due to oral PrEP scale‐up (Scenario 4, rollout to FSWs, SDCs and medium‐risk AGYW in all regions) from 2018 to 2030 by treatment scenario.