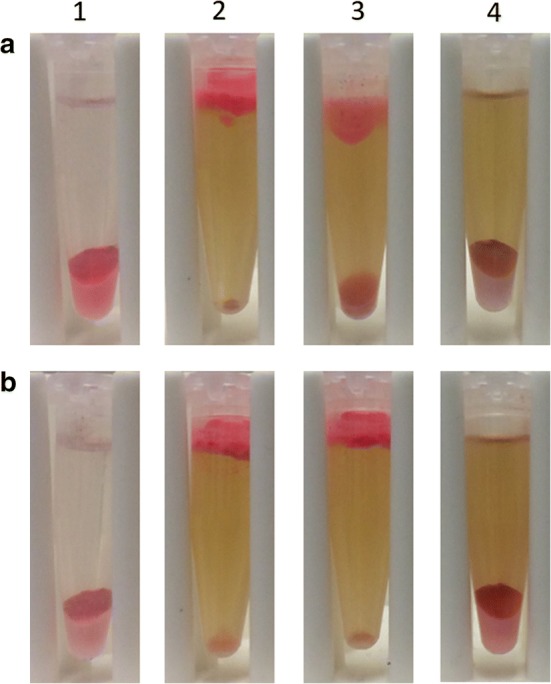
Fig. 4.

Pretreatment optimization analysis. The pretreatment optimization analysis was achieved by a using different concentrations of NaOH incubated for a 4 h with tailor-made enzymes (TMEs) and b 24 h with TMEs. Column (1) Control sample incubated with demi water, column (2) 1 M NaOH, column (3) 0.5 M NaOH column (4) 0.1 M NaOH. All assays were performed using a 24 h incubation time of NaOH pretreatment and a final TME concentration of 187 mg L−1
