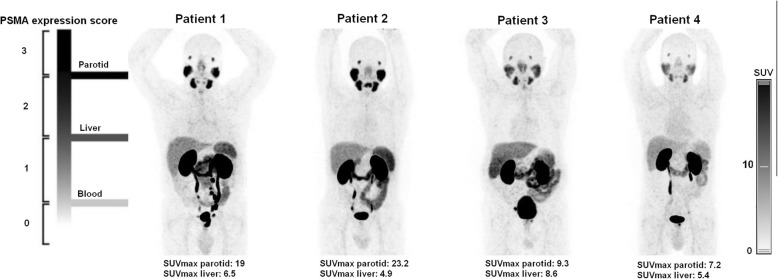
Fig. 4.
[68Ga]Ga-PSMA-11 PET maximum intensity projection images of four patients showing interindividual variability of PSMA expression of the liver and parotid, reference organs. The visual distinction between parotids and liver miPSMA expression scores is simple for patients 1 and 2 while miPSMA expression scores of liver and parotids is visually similar for patients 3 and 4. Left side of the figure adapted from Eiber et al. figure [7]

