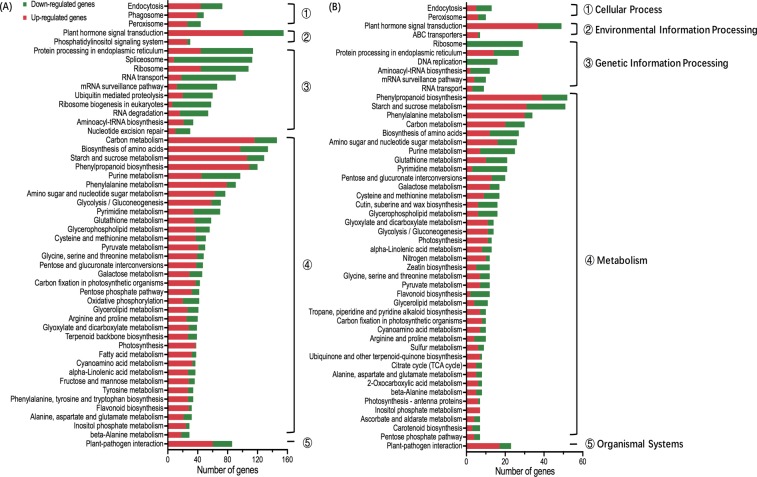
Figure 2.
KEGG classification of DEGs between sequential growth time points. (A) 6-HAI vs. 3-DAI and (B) 3-DAI vs. 6-DAI presented the top 50 KEGG pathways with the most abundance of DEGs, respectively. Regulatory profiles were presented as the number of up-regulated (red) and downregulated genes (green), within each category of KEGG pathways. All the pathways were classified into five categories, including cellular process, environmental information processing, genetic information processing, metabolism, and organismal systems.

