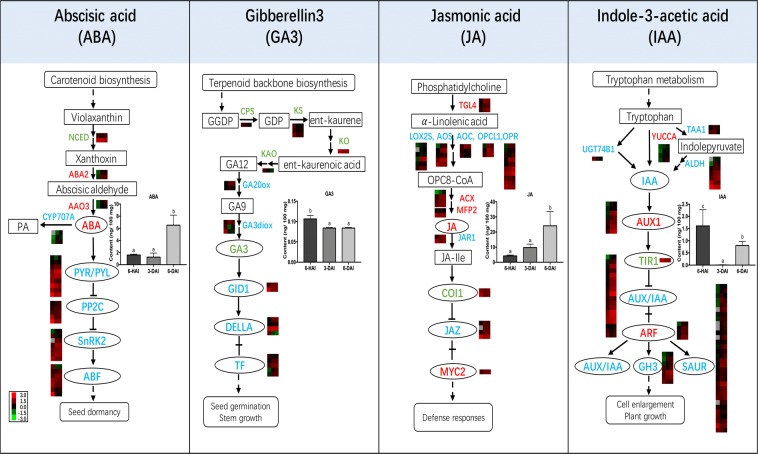
Figure 5.
Expression pattern of DEGs and profile changes of phytohormones during mung bean post-germination seedling growth. Key enzymes and proteins were presented as their names (in red up-regulated, in green down-regulated, in blue with mixed up- and down-regulated DEGs). Transcript abundance of DEGs were expressed as log10FPKM in heat maps. The three columns in each heat map represented the growth time points (6-HAI, 3-DAI and 6-DAI). The grey blocks indicated the transcript level was not quantified due to low expression. These DEGs were detailly exhibited in Table S8. The changes of related phytohormone contents were visualized on the bar graphs. Bars with different letters differed significantly at p < 0.05.

