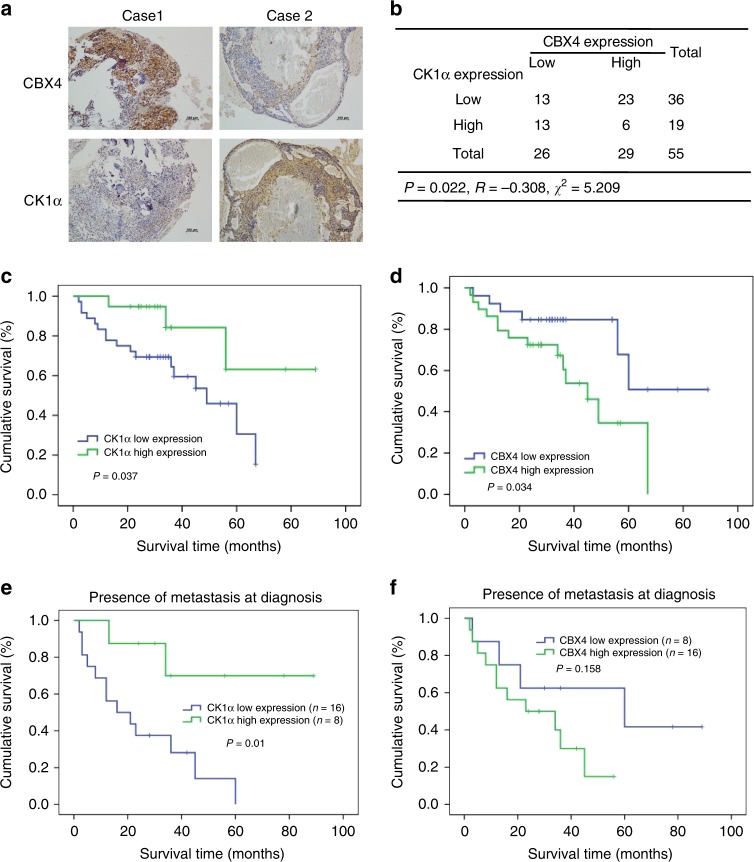
Fig. 6. Reverse correlation between CK1α and CBX4 in osteosarcoma tissues.
a Representative immunohistochemical staining images of both CBX4 and CK1α for 55 paraffin-embedded osteosarcoma tissues. Scale bar: 100 μm. b A positive correlation was observed between CBX4 and CK1α protein levels in the osteosarcoma tissues used in a (p = 0.022, χ2 tests. R: Spearman correlation coefficient). *p < 0.05 using the two-sided Pearson chi-squared tests. c–f Overall survival curves were generated based on the protein levels of CK1α (c, e) or CBX4 (d, f) in the osteosarcoma tissues used in a. *p < 0.05 using Kaplan–Meier plots and compared with the log-rank test.

