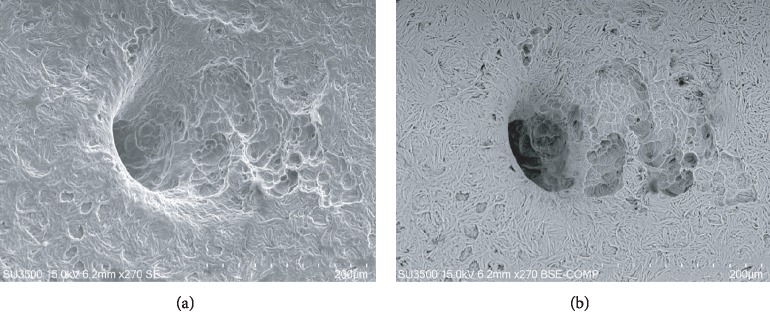
Figure 2.
(a) SE mode, 270x. Nutritive foramen from CHO incus bone. On the right side of the image, large resorption bays, extending since into the foramen, are visible. On the left corner of the picture, osteocytic lacunae are visible. (b) BSE-COMP mode, 270x of same sample. Darker (demineralized) areas correspond to deeper resorption bays. This field shows both bone resorption and bone formation phenomena.

