Figure S1.
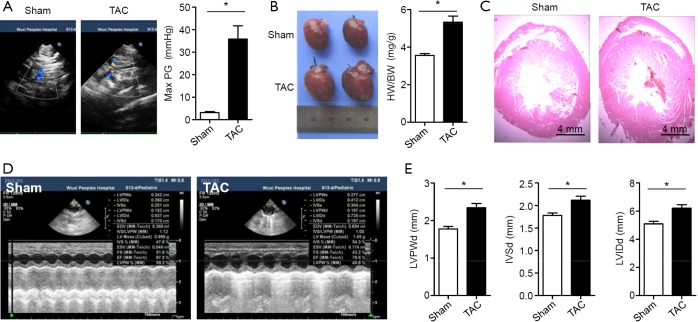
Pressure overload induced left ventricle hypotrophy. (A) One week after sham (n=14) or TAC (n=12) procedure, echocardiography was performed to measure the PG of the aortic arch. Representative images and data are shown; (B,C) hearts from sham and TAC rats were harvested and imaged eight weeks after the procedure; (B) representative images and HW/BW are shown; (C) representative heart sections from these rats were stained with HE; (D,E) echocardiography was performed to evaluate LVPWd, IVSd, LVIDd of the LV. *, P<0.05. LVPWd, left ventricular posterior wall end diastole; IVSd, interventricular septum end diastole; LVIDd, left ventricular internal dimension end diastole; LV, left ventricular.

