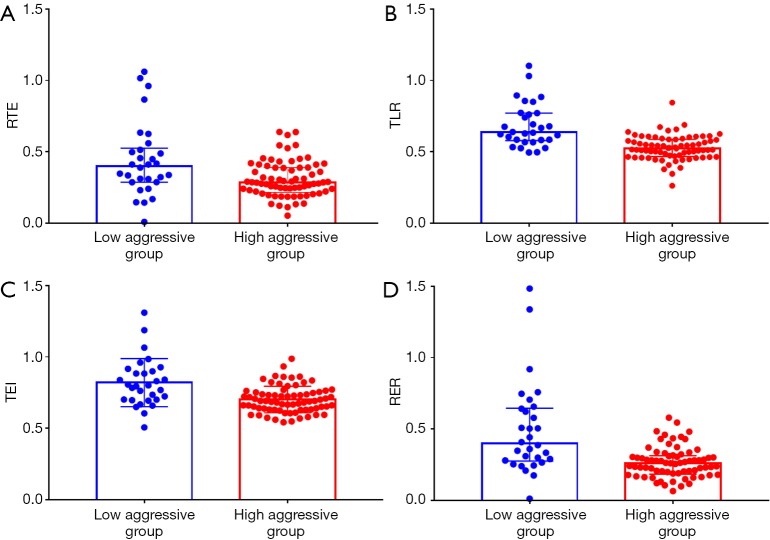
Figure 3.
Box and whisker plots are the differences in RTE, TLR, TEI, and RER between low and high aggressive groups (A,B,C,D). These quantitative parameters are significantly lower in the highly aggressive group (P<0.05). RTE, relative tumor enhancement; TLR, tumor to liver contrast ratio; TEI, tumor enhancement index; RER, relative enhancement ratio.

