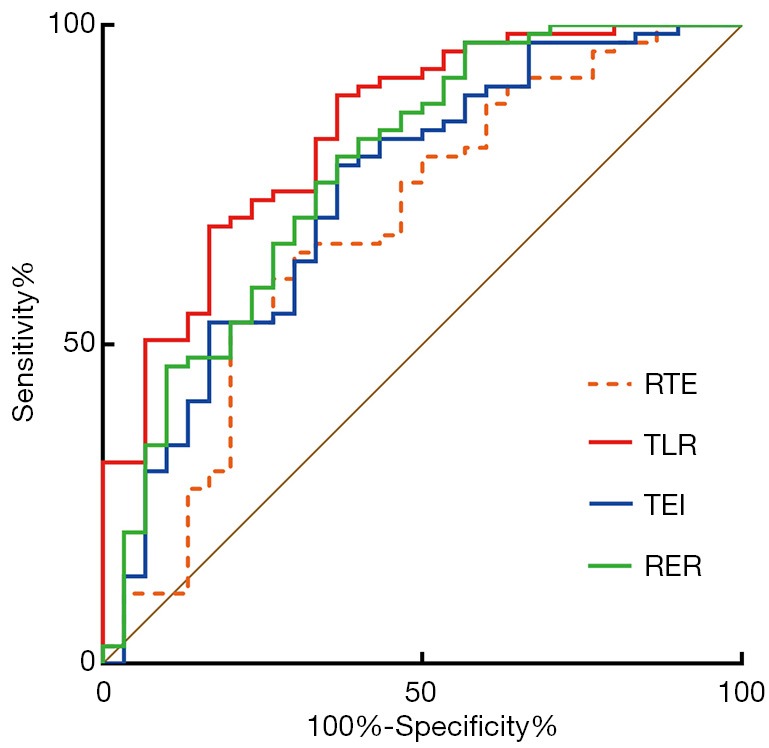
Figure 4.

ROC curve of RTE, TLR, TEI, and RER derived from hepatobiliary phase for predicting HCC with highly aggressive behavior. The AUCs for predicting high aggressive HCC were 0.68 (95% CI: 0.58–0.77) for RTE, 0.83 (95% CI: 0.75–0.90) for TLR, 0.74 (95% CI: 0.64–0.82) for TEI and 0.78 (95% CI: 0.68–0.85) for RER. ROC, receiver operating characteristic; RTE, relative tumor enhancement; TLR, tumor to liver contrast ratio; TEI, tumor enhancement index; RER, relative enhancement ratio.
