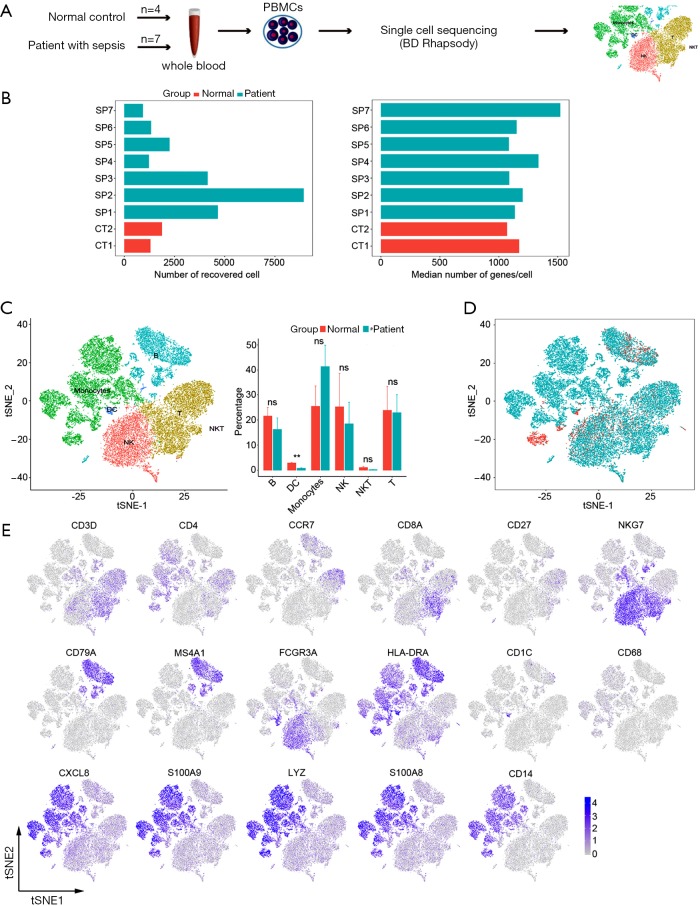
Figure 1.
The transcriptomes profile of PBMCs from controls and septic patients at a single-cellular level. (A) Schematic showing the transcriptome experiment of PBMCs; (B) the number of cells and the median number of genes that passed quality filtering (2 control samples, CT1-CT2; and 7 septic patients, SP1-SP7); (C) tSNE plot visualization of PBMCs indicates 6 cell types (left) and bar plot showing cell fractions in normal control and septic patients (right); (D) the subject of normal origin control and patients with sepsis displayed by a distinct color; (E) expression levels of established cell markers shown by two-dimensional tSNE visualization. PBMCs, peripheral blood mononuclear cells; tSNE, t-distributed Stochastic Neighbor Embedding.

