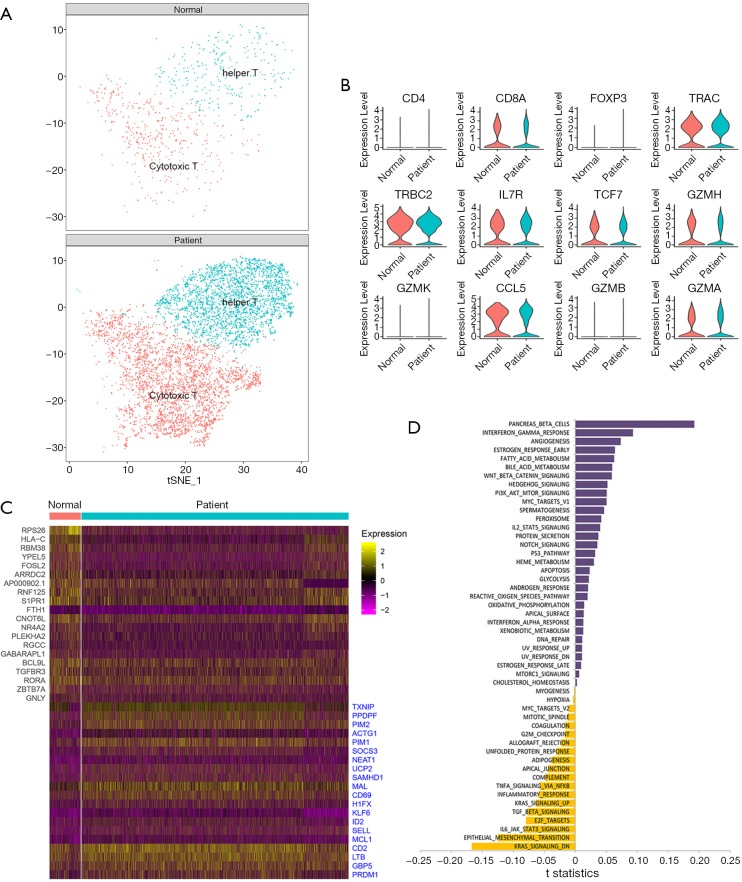
Figure 2.
Single-cell analysis of T cells. (A). Two-dimensional tSNE visualization of 2 clusters of T cells, distinct colors represent different clusters (cytotoxic T and helper), (Top and Bottom) show controls and sepsis, respectively; (B) the expression distribution of representative selected genes associated with T cells in control and sepsis, shown by Violin plots; (C) heatmap represents the top differential genes expressed in T cells from control and sepsis, 20 genes were highly expressed in the normal group, and 20 genes were highly expressed in sepsis; (D) bar plot of the differences in the signal pathway between normal and sepsis-induced T cell. Shown in t-statistics, results from the GSVA score comparison tests comparing sepsis with controls. tSNE, t-distributed Stochastic Neighbor Embedding; GSVA, gene set variation analysis.

