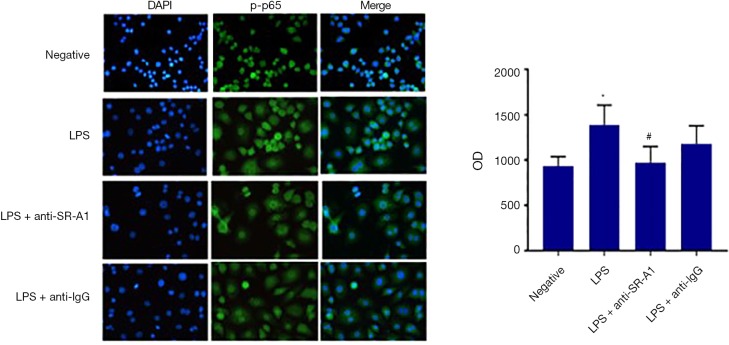
Figure 2.
NF-κB p-p65 expression in RAW264.7 cells with different treatments. NF-κB p-p65 expression was determined by immunofluorescence staining. Nuclei were stained with DAPI, and green signal represented NF-κB p-p65 (×100). Data are presented as the mean ± SEM (*, P<0.05 vs. negative group; #, P<0.05 vs. LPS group). SEM, standard error of the mean; LPS, lipopolysaccharide; SR-A1, A1 scavenger receptor; OD, optical density.

