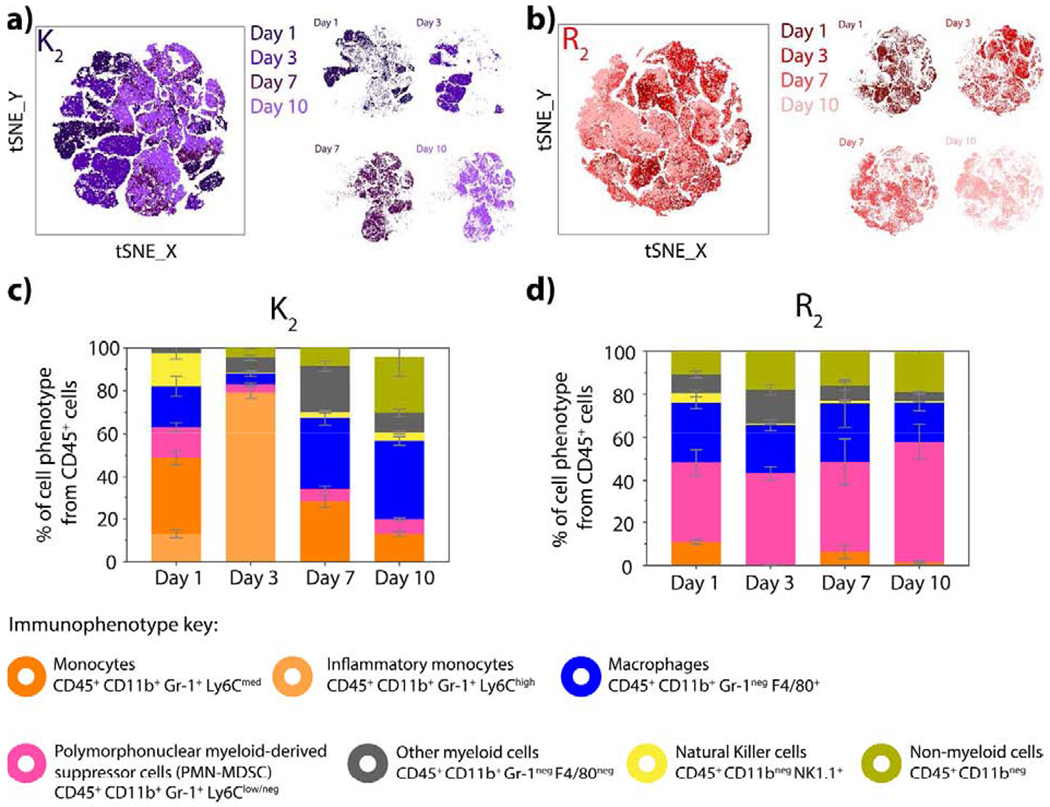
Fig. 6. Time course progression of the infiltrating cell populations for positively-charged MDP hydrogels.

tSNE clustering of cells infiltrating a) K2 and b) R2 at day 1, 3, 7 and 10 post-injection using the 6-color myeloid panel. c) Percentage of inflammatory monocytes, monocytes, PMN-MDSC, macrophages, NK cells and other leukocytes from CD45+ cells that infiltrate d) K2 and R2 peptide hydrogels at day 1,3, 7 and 10 post-injection. Error bars represent the standard deviation.
