Fig. 1.
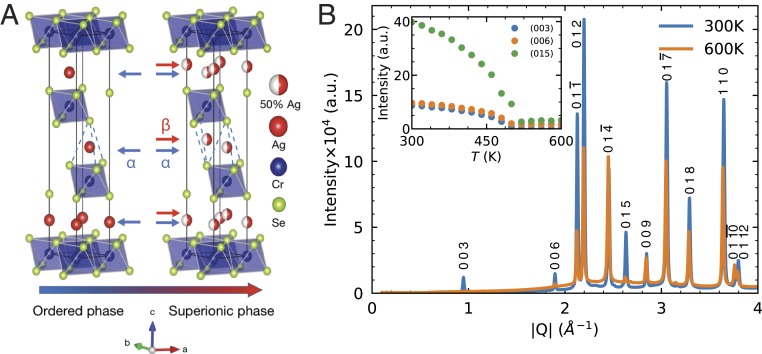
Crystal structure and phase transition in . () Crystal structure of . Ag, Cr, and Se atoms are shown in red, blue, and green, respectively. Half-red–half-white spheres indicate 50% occupancy of Ag atoms. The blue dashed lines indicate the Se tetrahedron. Below 475 K, the sites are fully occupied. Above , both and sites are occupied with 50% probability. () X-ray powder diffraction pattern at 300 K (blue) and 600 K (orange), obtained from APS sector 11-ID-C ( 105.708 keV). Inset shows the integrated intensities of (003), (006), and (015) Bragg peaks as a function of temperature on heating, plotted as blue, orange, and green dots, respectively. The intensities are suppressed around nominal temperature 500 K.

