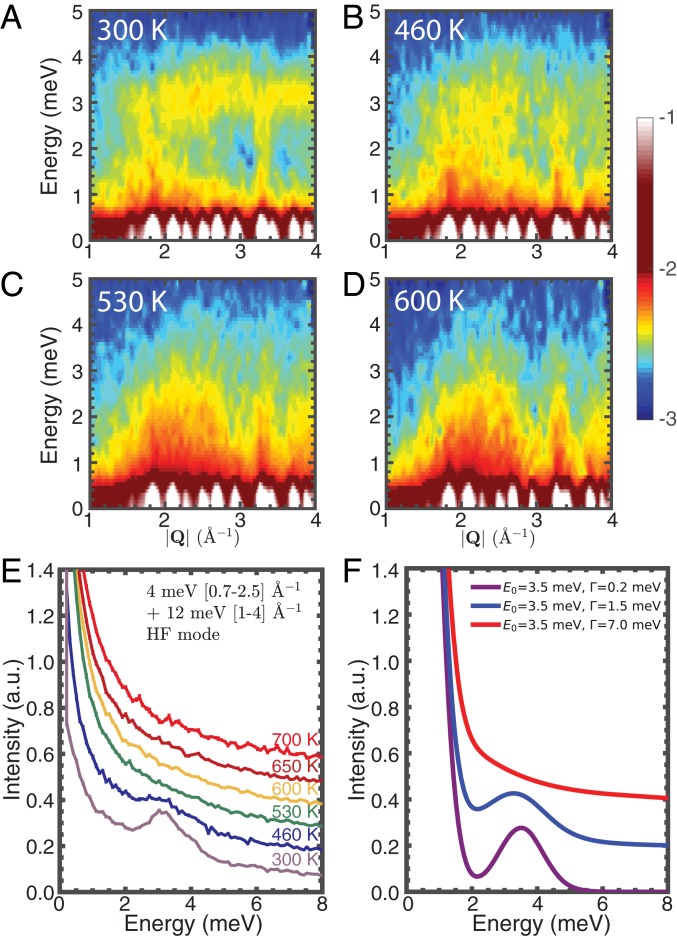
Fig. 2.
INS measurements reveal two behaviors in different portions of the acoustic phonon branch. (A–D) S() maps measured with = 12 meV at the CNCS in the ordered phase, () 300 K and () 460 K, and the superionic phase, () 530 K and () 600 K. The horizontal band around 3.5 meV at 300 K shows the nondispersive phonons. This mode damps and merges into the quasielastic lines at . The vertical streaks, which intensify with increasing temperature, represent the dispersive acoustic phonons especially at = 3.3 . () cuts from = 4 and 12 meV data, integrated over the range of 0.7 2.5 and 1 4 , respectively. The two datasets are stitched by matching intensities at 2 meV. The 3.5-meV peak broadens with temperature increase and smears out at and the quasielastic width increases. () Model S() from the DHO with energy and damping width , convoluted with the instrument resolution (FWHM = 1.5 meV). Elastic line is included. Purple, blue, and red represent S() at 300, 460, and 750 K.

