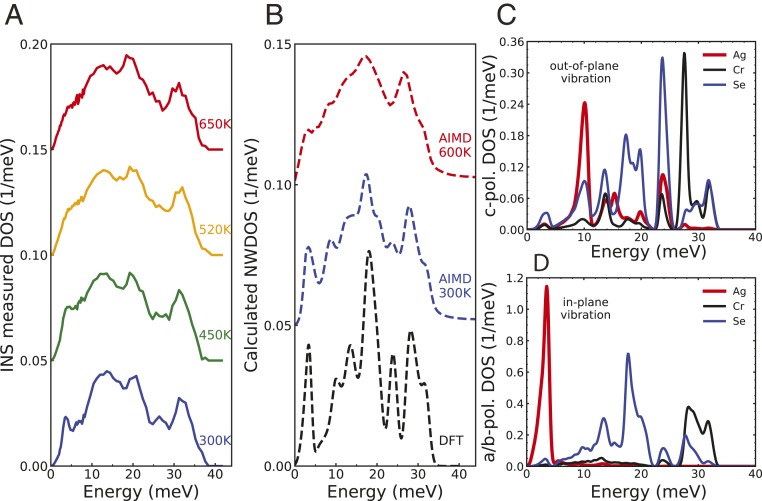
Fig. 3.
Phonon DOS from experiments and simulations. () INS powder measurements at the ARCS with and 80 meV to get fine resolution at the low-energy portion and the whole spectrum. Data are stitched together at 9 meV. Blue, green, orange, and red lines are measured at 300, 450, 520, and 650 K, respectively. () Calculated neutron-weighted DOS. Black dashed line is labeled as DFT, and AIMD at 300 and 600 K are blue and red dashed lines, respectively. ( and D) Site-projected DOS from DFT for the -axis polarized (C) and in-plane () motions in the – plane. Ag motions mainly contribute the strong peak around 3.5 meV for the in-plane vibration and a weaker peak near 10 meV for polarizations.

