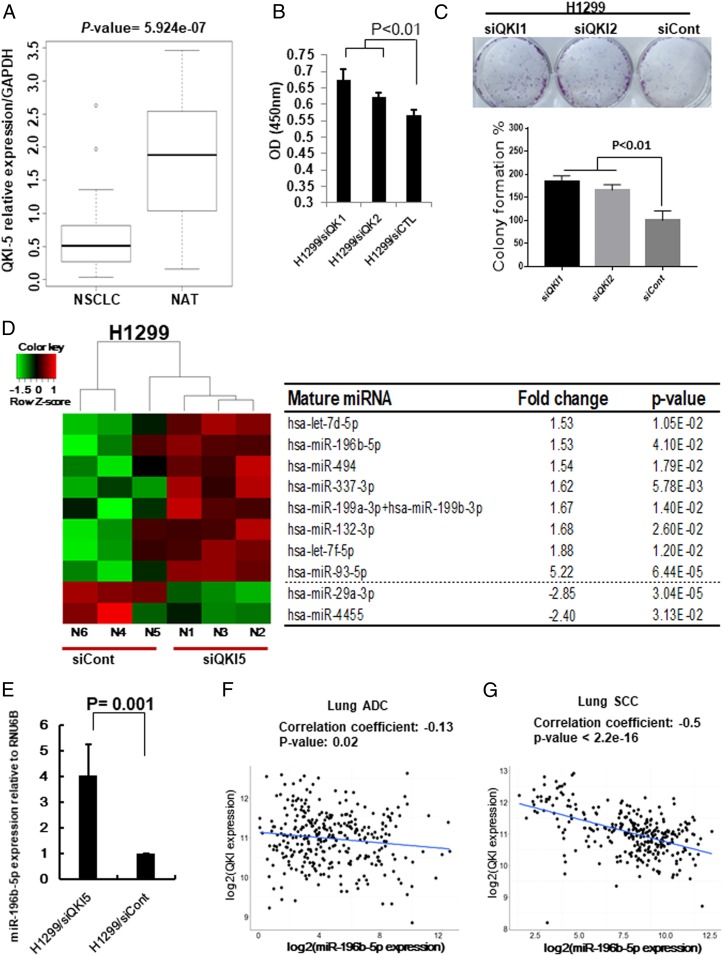
Fig. 1.
QKI-5 down-regulation promotes miR-196b-5p expression. (A) Expression level of QKI-5 in 60 paired NSCLC tissues and their matched NATs. The RNA samples were extracted from 30 NSCLC tissues and 30 corresponding NATs. The RNAs were subject to qRT-PCR with a QKI-5 probe and the expression was normalized by GAPDH. (B and C) Cell proliferation assay (B) and colony formation assay (C) for QKI-5 knockdown H1299 cells. The cell growth rates were measured by cell counting kit 8. The values present mean ± SD as determined by quintuplet assays. Colony-forming areas were measured by ImageJ software. The average values were derived from three random areas. (D) Results of NanoString miRNA assay by comparing QKI-5 knockdown H1299 cells (H1299/siQKI) and control (H1299/siCont) cells. (E) qRT-PCR measure miR-196b-5p expressions in H1299/siQKI and H1299/siCont cells. (F and G) QKI expression from TCGA RNA-seq data and miR-196b-5p expression from miR-seq data were used to examine correlation between miR-196b-5p and QKI expressions in lung ADC dataset (n = 306) (F) and lung SCC dataset (n = 289) (G).

