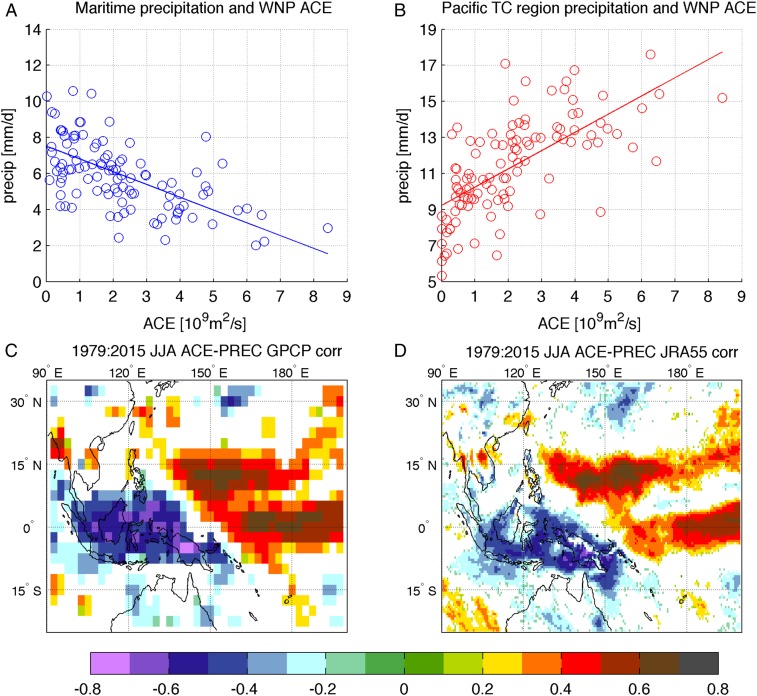
Fig. 1.
Correlation of precipitation with ACE. (A and B) Scatter plots of JJA monthly values of ACE over the WNP (units are 109 square meters per second) and GPCP precipitation (units are millimeters per day) over (A) the Maritime Continent (8°S to 8°N, 100°E to 135°E) and (B) the West Pacific TC region (8°N to 22°N, 120°E to 155°E) from 1979 to 2015. (C and D) The correlation between ACE and the GPCP/JRA-55 precipitation for the same period, with average JJA values. White patterns represent regions where the correlation is not statistically significant.

