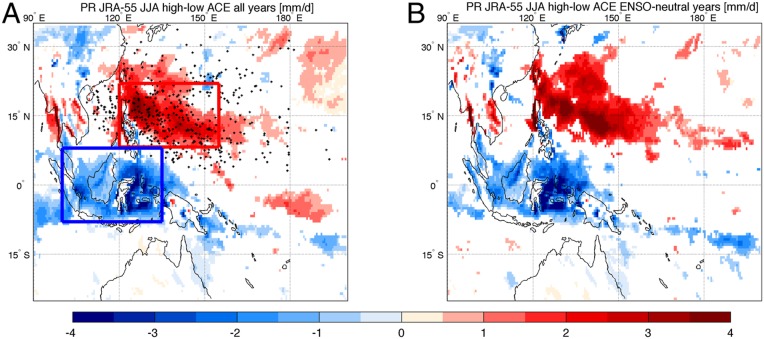
Fig. 2.
Comparison between precipitation associated with high-ACE and low-ACE years. The difference between JJA JRA-55 precipitation associated with high-ACE (higher than the median) and low-ACE years is shown (A) considering the whole period 1979–2015 and (B) considering ENSO neutral years only. Units are millimeters per day. Black dots represent the origin of TCs observed in this period. Blue and red boxes in A mark the domain used to compute the Maritime Continent and West Pacific TC region averages, respectively. White patterns represent regions where the difference is not statistically significant.

