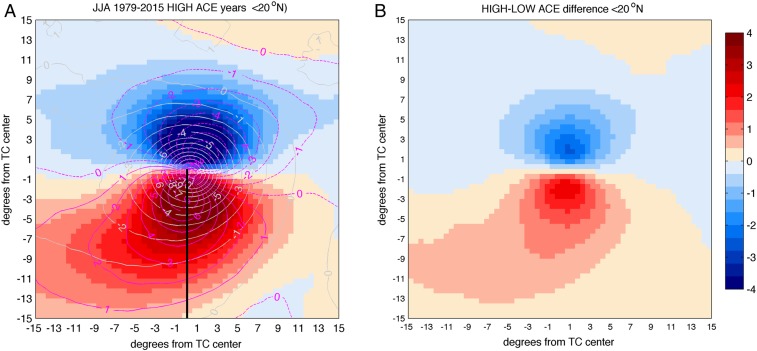
Fig. 4.
(A) JJA TC daily composite anomalies with respect to the daily 1979–2015 climatology during HIGH ACE years and (B) difference between HIGH and LOW ACE years over WNP. TC accumulated zonal water transport (color shading, 1010 kilograms per meter, positive values indicate eastward transport), zonal wind velocity (purple lines, meters per second), and sea level pressure (light gray lines, hectopascals) anomalies are shown. Only TCs traveling south of 20°N are considered. B shows the difference between HIGH and LOW composite accumulated water transport over the 1979–2015 period (units are 1010 kilograms per meter). The black line in A indicates the section used to integrate TC-associated eastward water transport.

