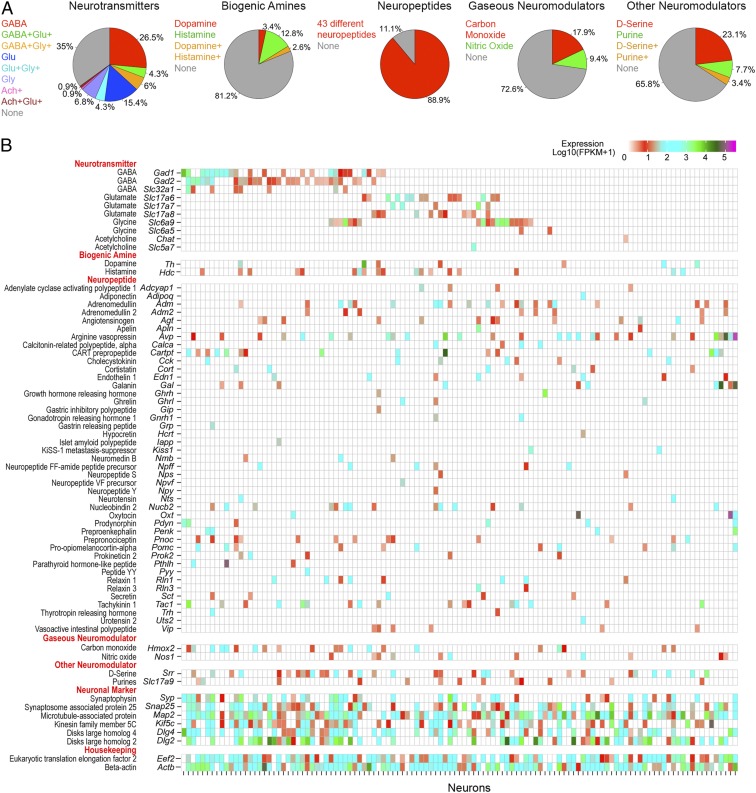
Fig. 2.
Neurons upstream of CRHNs express a large array of signaling molecules. (A) Pie charts show percentages of upstream neurons expressing different neurotransmitters, biogenic amines, neuropeptides, gaseous neuromodulators, and other neuromodulators. (B) Heat map illustrating expression levels of different signaling molecules expressed in 117 individual upstream neurons. Different neurons are indicated on the x-axis. The y-axis shows different signaling molecules, neuronal markers, and housekeeping genes and their encoding or indicator genes.

