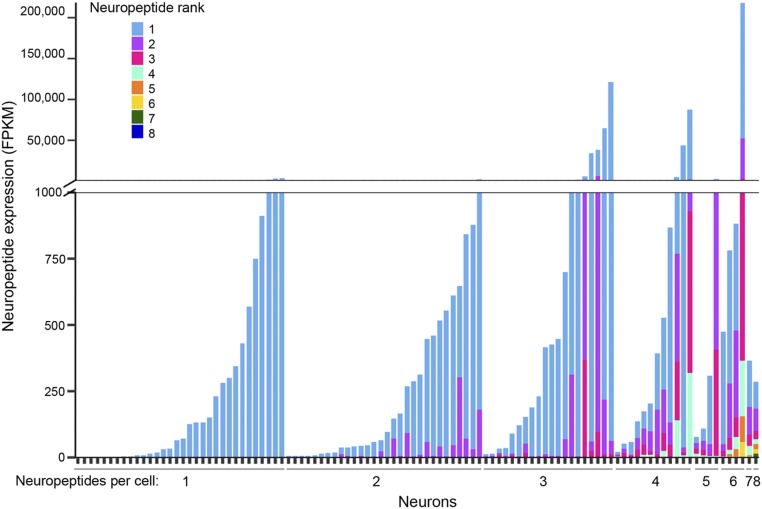
Fig. 5.
Coexpression of neuropeptides in individual neurons. Expression levels of different neuropeptides in single neurons varied. Cells are arranged on the x-axis by the number of neuropeptides they expressed (1–8). Vertical bars indicate expression of neuropeptides in each cell, with different neuropeptides indicated in different colors and their expression in FPKM shown on the y-axis.

