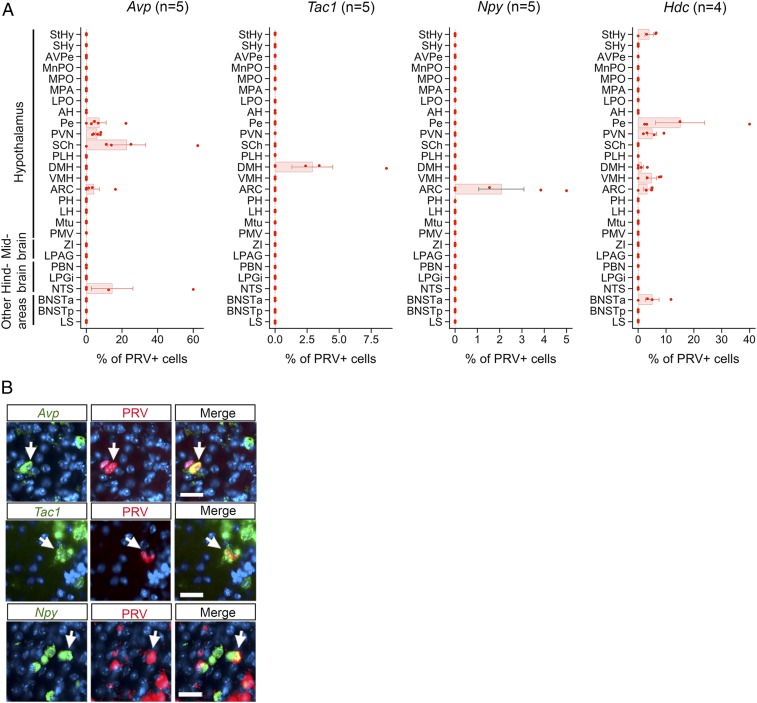
Fig. 6.
Upstream neurons expressing individual signaling molecules map to specific brain area(s). (A) Graphs show the percentage of PRV+ neurons labeled for different neuromodulators (Avp, Tac1, Npy, or Hdc) in different brain areas following CRHN infection with PRVB177. Error bars indicate SEM. Parenthesized numbers indicate the number of animals (“n”) per condition. (B) CRHNs were infected with PRVB177 and brain sections costained on d3pi with neuropeptide riboprobes (green) and anti-HA antibodies (red; PRV+ cells). Arrows indicate colabeled neurons. (Scale bars, 25 μM.)

