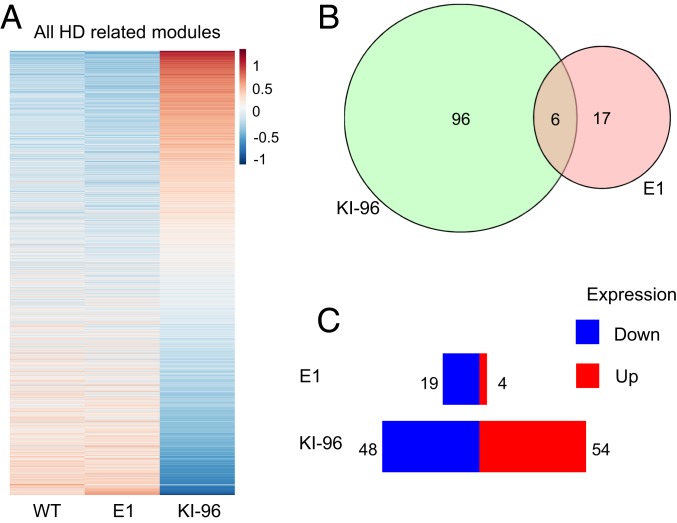
Fig. 4.
Transcriptional profiling of the striata from E1 and KI-96 mice. (A) Heat map view of gene expression in selected striatum modules consisting of M2 (repeat-associated HD signaling), M7 (cell death signaling), M9 (mitochondria and transport), M20 (UBI conjugation), M25 (glutamate receptor signaling), M39 (DNA repair), M43 (fatty acid catabolic process), and M46 (glucocorticoid signaling) from WT, E1, and KI-96 mice (6 mo old, n = 7 for WT mice, 4 for E1 and KI-96 mice). (B) Overlap of significantly changed genes when comparing E1 or KI-96 mice with WT mice. (C) Overview of significantly changed genes in selected striatum modules when comparing E1 or KI-96 mice with WT mice. More genes in KI-96 mice show altered expression than in E1 mice. Data represent the mean ± SEM.

